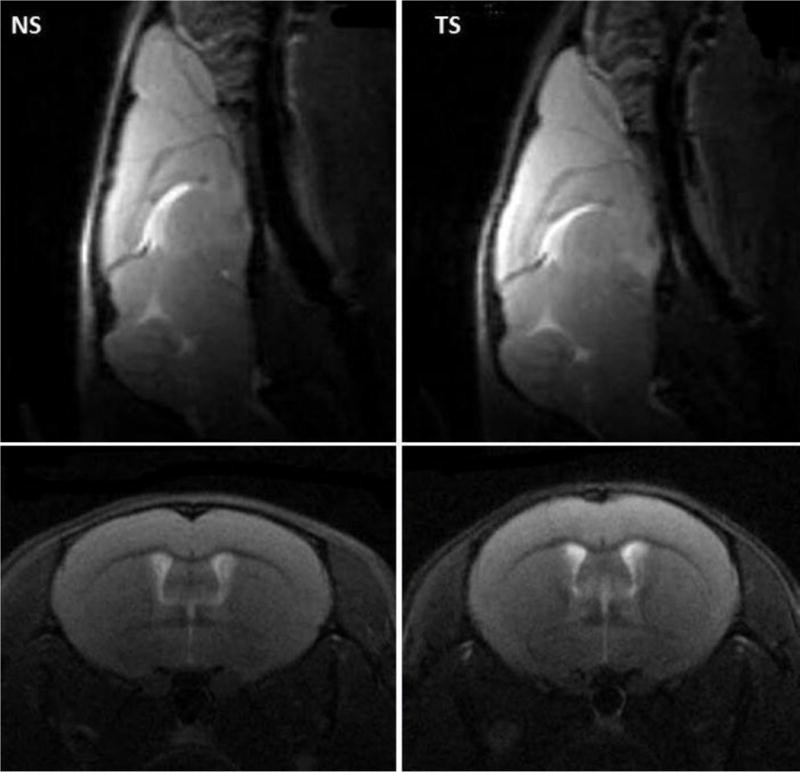
Figure 2.

Sagittal and coronal anatomical MRI showing the phenotypic difference between the brains of the Ts65Dn (TS) and normossomic control (NS). Note the increase of the cerebrum height and decrease of the rostrocaudal length of the cerebrum and mediolateral width of the posterior cerebrum in the TS mice.
