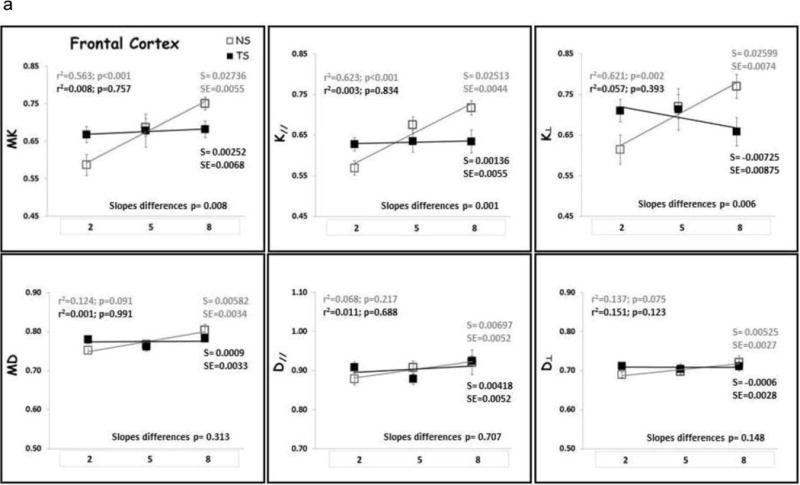
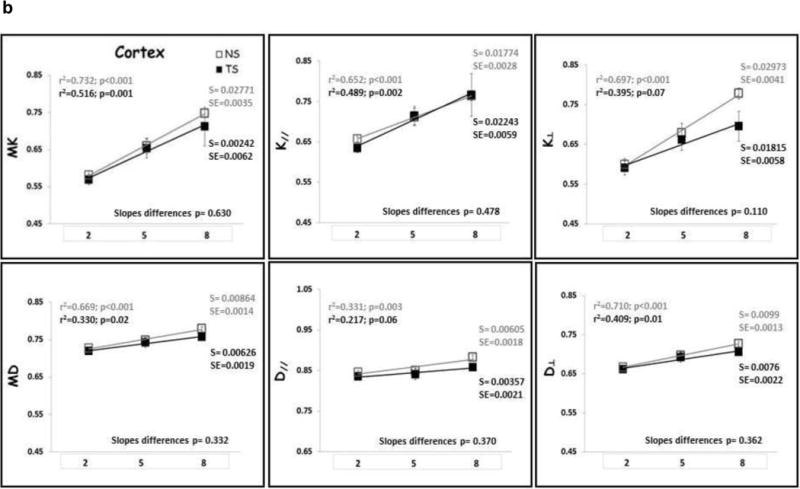
Figure 4.


(A) Frontal cortex (FC) and (B) Cortex (CT) DK and DT metrics means with age. TS mice are represented by black square, black regression line and black r2 and slope values; NS mice are represented by gray square, gray regression line and gray r2 and slope values. S= slope; SE= standard error of the slope. Mean diffusivity (MD); axial diffusivity (D‖); radial diffusivity (D⊥); mean kurtosis (MK); axial kurtosis (K‖); radial kurtosis (K⊥); months of age (2, 5 and 8).
