
Figure 4.
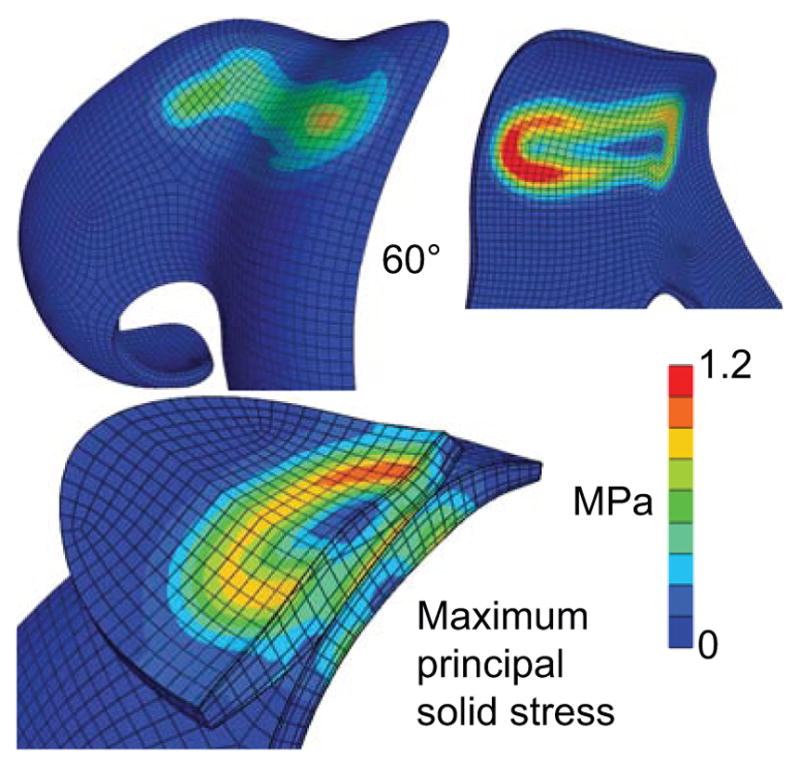
Maximum principal solid stress on a representative patellofemoral joint at 60 degrees of knee flexion. The distribution of at the articular surface (top left) has a similar pattern to (but smaller magnitude than) the contact stress (Figure 2). At the subchondral bone surface (top right), shows a ring-like pattern coinciding with the footprint of the peak contact stress gradient. The transition in the distribution of this solid stress from the articular surface to the subchondral bone is visible on the cross-section of the PFJ (bottom left).