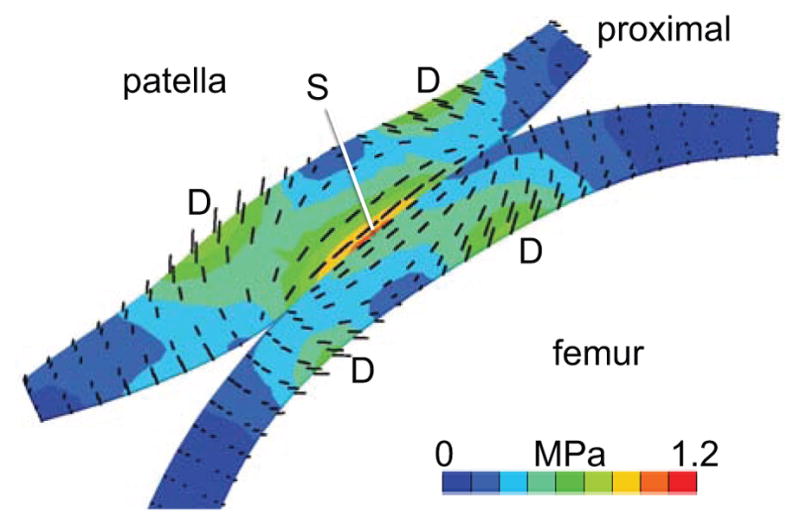
Figure 5.

Mid-sagittal cross-section of a PFJ model at 60 degrees of flexion, showing principal directions of the maximum solid stress (black lines, scaled to the magnitude of ). Principal directions in the superficial zones of the patella and femur (S) are parallel to the articular surface and aligned with the direction of relative motion. In the deep zone, principal directions at the site of local peak stress magnitudes (D) make an angle of ±45 degrees with the normal direction to the subchondral bone surface.
