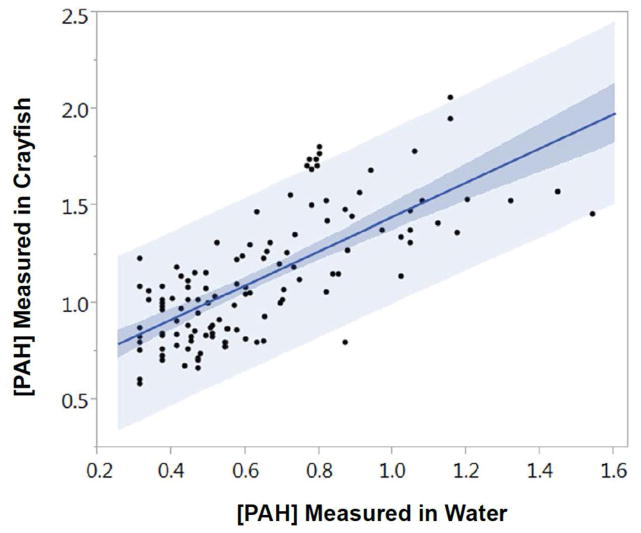
Figure 2.
Linear regression of 34 individual [PAH], measured in spatially and temporally paired crayfish viscera ( ) vs. water ( ). Samples were collected upriver, within, and downriver of the Portland Harbor Superfund Megasite (PHSM) in the Willamette River in Portland, Oregon. R-squared = 0.52, correlation coefficient = 0.72. Dark shading represents confidence intervals and light shading represents prediction intervals. The slope of the line of best fit is 0.88 ± 0.078 and the intercept is 0.56 ± 0.054.

