Significance
Understanding protein folding is, as yet, an unsolved question in the life sciences that has relevance for many diseases. While the folding of simple and small protein domains is well studied, for large proteins, the abundance of pathways and intermediate states makes them difficult to characterize using standard protein folding experiments. With single-molecule optical tweezers experiments, we can overcome these limitations. We observe in real time the folding of a dimeric, three-domain protein from the fully unfolded chain to the biologically active, quaternary structure. The likelihood of the folding process being hindered by misfolded intermediates increases with chain length. These misfolded states can slow down folding significantly and may lead to aggregation in vivo.
Keywords: misfolding, off-pathway, rough energy landscape, optical tweezers
Abstract
Folding of small proteins often occurs in a two-state manner and is well understood both experimentally and theoretically. However, many proteins are much larger and often populate misfolded states, complicating their folding process significantly. Here we study the complete folding and assembly process of the 1,418 amino acid, dimeric chaperone Hsp90 using single-molecule optical tweezers. Although the isolated C-terminal domain shows two-state folding, we find that the isolated N-terminal as well as the middle domain populate ensembles of fast-forming, misfolded states. These intradomain misfolds slow down folding by an order of magnitude. Modeling folding as a competition between productive and misfolding pathways allows us to fully describe the folding kinetics. Beyond intradomain misfolding, folding of the full-length protein is further slowed by the formation of interdomain misfolds, suggesting that with growing chain lengths, such misfolds will dominate folding kinetics. Interestingly, we find that small stretching forces applied to the chain can accelerate folding by preventing the formation of cross-domain misfolding intermediates by leading the protein along productive pathways to the native state. The same effect is achieved by cotranslational folding at the ribosome in vivo.
Large protein machines consist of long amino acid chains, often exceeding many hundreds or even over a thousand residues in length. Although the in vitro folding of small and medium-sized proteins is relatively well understood (1–5), very limited information exists about the complete folding process of such large proteins (6). In general, larger proteins often exhibit a multitude of intermediate and aggregation-prone misfolded states (4, 7). Recently, it has been shown that in multidomain proteins with homologous domains, cross-repeat intermediates can greatly slow down productive folding (8) but little is known about how size effects influence the folding of very large (>500 residues) nonhomologous multidomain proteins.
Methods providing dynamic as well as structural information are rare, and many bulk methods often do not provide enough resolution to deal with the multitude of states expected for complex systems such as the aforementioned large protein complexes. Single-molecule force spectroscopy offers kinetic, energetic as well as coarse primary structural information combined with the possibility of actively manipulating systems, making it ideally suited for studying the folding of large proteins (5, 9–12).
In this paper, we study the folding and assembly of the large chaperone machinery heat shock protein 90 from yeast (Hsp90), a protein that needs to fold and self-assemble before it can function as a chaperone in the cell. Hsp90 consists of three domains, the N-terminal domain (N domain, 211 residues), the middle domain (M domain, 266 residues), and the C-terminal domain (C domain, 172 residues). In eukaryotic Hsp90, the N and M domains are connected by a long (62 residues) charged linker that can bind transiently to the N domain (13). In addition, the C domain is partly unstructured (residues 678–709). Hsp90 protomers form biologically active dimers through helix pairs in the C domains (residues 640–672) (14). Early equilibrium bulk studies suggest that the unfolding and refolding of isolated Hsp90 is mostly reversible and an unspecified intermediate is populated (15).
Results
Monomer Unfolding and Refolding.
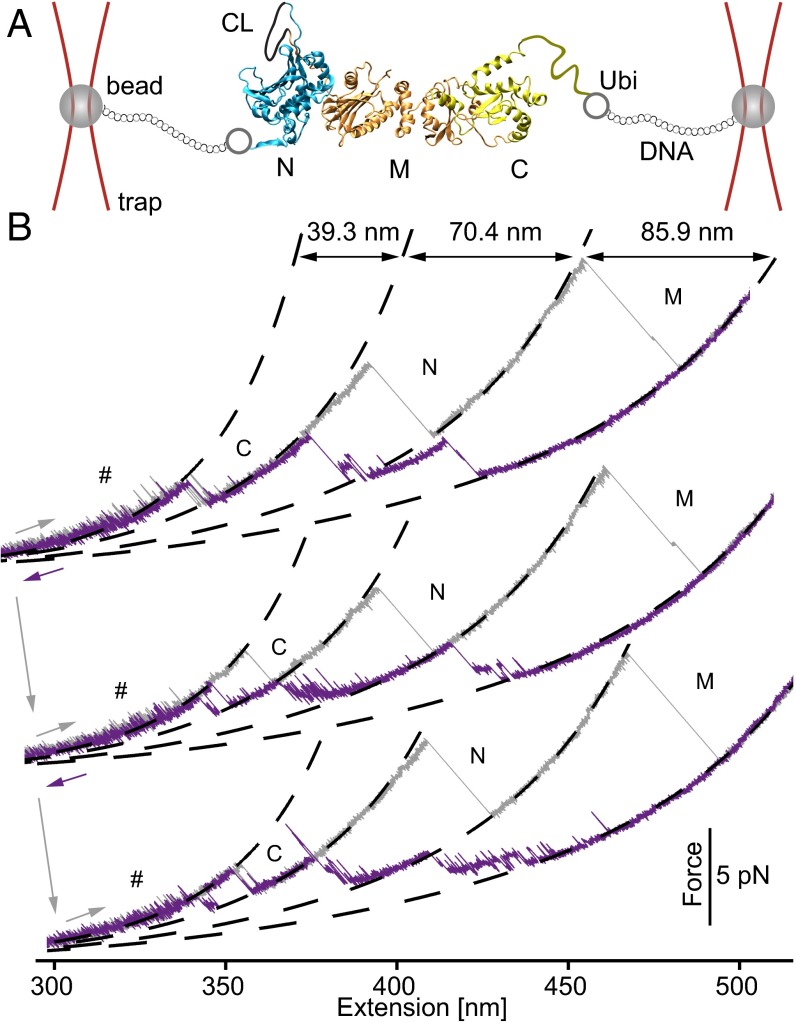
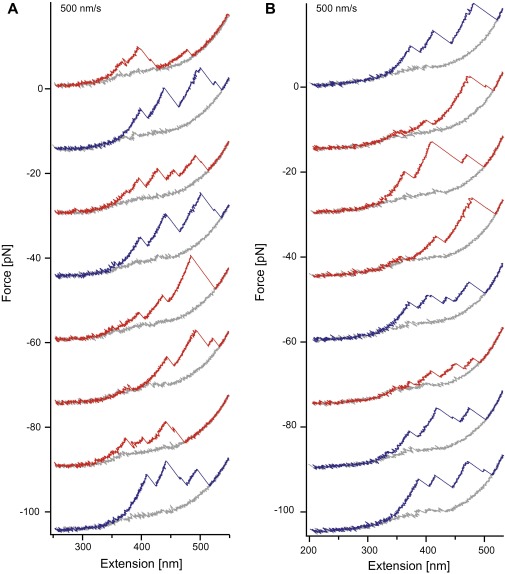
In the first set of experiments, we investigated the overall folding properties of the Hsp90 monomer. To this end, we designed a mutant construct carrying two cysteine-modified ubiquitin domains at each terminus. These serve as attachment points for the DNA handles used to link the construct to the trapped beads (Fig. 1A and Methods). Fig. 1B shows three stretch and relax cycles obtained at a slow pulling velocity of 10 nm/s in which a single Hsp90 monomer was consecutively unfolded and refolded. The unfolding traces (gray) show a characteristic unfolding pattern exhibiting three major peaks that we had previously identified as the unfolding of the C, N, and M domains of Hsp90 (13). At low forces before the domains unfold, fast transitions can be observed that arise from the rapid docking and undocking of the charged linker that connects the N and M domains (“#” in Fig. 1B) (13). The completely unfolded Hsp90 monomer starts refolding (purple traces) at high forces (∼5 pN) through a complex sequence of near-equilibrium transitions and folding intermediates. Usually, the major refolding transitions fall on top of the unfolding traces, suggesting that the three domains refold sequentially. After successful refolding, the charged linker fluctuations also become visible. All subsequent unfolding traces show the full native Hsp90 unfolding pattern. At a faster pulling velocity of 500 nm/s, we find that just 36% of the traces completely refold, suggesting that complete refolding occurs within less than 2.5 s (see Fig. S1 and Estimate 1).
Fig. 1.
Hsp90 monomers fold through a complex network of states. (A) Optical tweezers assay. An Hsp90 monomer carrying N- and C-terminal ubiquitins (gray circles) is tethered via DNA handles to silica beads (gray spheres), held in optical traps. By moving one of the beads away from the other along the long axis of the protein, we apply force to the Hsp90 monomer (PDB ID 2CG9). Hsp90 consists of an N (blue), an M (orange), and a C (green) domain. The N and M domains are connected by a charged linker (CL, black line). The unstructured part of the C domain is indicated by a green line. The figure is not to scale. (B) Three consecutive force-extension traces of an Hsp90 monomer that were acquired by moving the beads apart and together at a slow, constant speed of 10 nm/s. Unfolding traces (gray) show identical, successive unfolding of the three domains. Worm-like chain (WLC) fits to the unfolding events, shown as dashed lines, mark Hsp90’s domains (C, N, and M). Average contour length gains (see SI Structure Sizes and Table S1) are displayed in the top trace. Refolding traces (purple) from the completely unfolded state show that refolding sets in at ∼5 pN. Apart from the major refolding events, many rapid transitions are observed.
Fig. S1.
Force-extension cycles of Hsp90 monomers at a velocity of 500 nm/s. (A) Consecutively unfolding (colored) and refolding (gray) force extension traces of an Hsp90 monomer at a velocity of 500 nm/s. For clarity, the traces are offset by 15 pN each. At this speed, we can observe the complete native pattern (blue) and the not completely refolded molecules (red). (B) The same as A but for a different molecule. To estimate the overall folding rate of Hsp90 monomers at this folding speed, we evaluated the refolding probability of five molecules (238 traces). The average of the individual refolding probabilities is 36% ± 7% (SD).
Refolding of the Individual Domains.
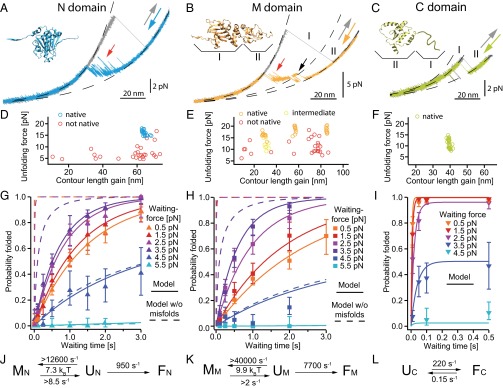
To better understand the complex behavior of the refolding events observed for the monomer, we investigated the refolding of the individual domains. We designed separate constructs of the N, M, and C domains (see SI Methods). Slow 10-nm/s unfolding traces (Fig. 2 A−C, gray) show the characteristic unfolding forces and lengths already observed in the monomer (Fig. 1B). The refolding traces (Fig. 2 A−C, colored) exhibit a number of intermediate states for the N (blue) and M domain (orange), whereas the C domain (green) shows two-state behavior.
Fig. 2.
Detailed analysis of individual domain constructs. (A−C) Force-extension traces of individual domain constructs (Insets from PDB 2cg9) at a slow pulling speed of 10 nm/s. Unfolding traces (gray) are fitted with WLCs (black dashed). Refolding traces of the N (A, blue) and the M (B, orange) domains populate transient intermediate states (A and B, red arrows). The M domain (B) populates an on-pathway intermediate (black arrow) that corresponds to region II. The C domain (C) shows equilibrium two-state behavior; region I accounts for unstructured regions. More traces are shown in Fig. S2 A, C, and E. (D−F) Scatter plots display unfolding events (unfolding force vs. contour length gain) for the N (D), the M (E), and the C (F) domains. Each scatter plot is derived from 35 to 75 consecutive traces of one molecule. The native structured M domain can appear as a single event (orange, longest length gain) or as a double event (orange, shortest plus medium length gain) depending on the classification algorithm (see SI Methods). If only the on-pathway intermediate is observed (B, region II), it is colored in yellow. (G−I) Averaged refolding probabilities derived from double jump experiments (see Fig. S6 for nonaveraged data) depending on time (y axis) and force (color-coded) for the N (G), the M (H), and the C (I) domains. Probabilities are determined from 11,570 traces (45 molecules), 7,927 traces (14 molecules), and 6,157 traces (9 molecules) for the N, M, and C domains, respectively. The N and M domains show increasing refolding probability with increasing force (G and H, orange to purple markers). Fits are described in J−L. For uncertainties, see SI Methods. (J−L) The atypical refolding behavior of the N and M domains is fully described by a model (J and K) assuming an unfolded state ensemble U that is in equilibrium with fast-forming off-pathway intermediates M, that prevent folding to the native state F. Fitting this model to the nonaveraged data (Fig. S6 A and B) yields fits shown in G and H as continuous lines. Assuming identical folding parameters and neglecting misfolding yields the refolding probabilities shown in G and H as dashed lines. The C domain is fitted with a two-state model assuming an unfolded U and a folded state F in equilibrium (L, continuous lines in I and Fig. S6C). The folding rates at zero force, the equilibrium energy between U and M, and lower estimates for the rates from and to the misfolded states (see Estimate 3) are displayed.
Several observations suggest that the intermediate observed in the M domain (black arrow in Fig. 2B) is an on-pathway folding and unfolding intermediate. First, at the resolution of our experiment, all folding events to the native state have to pass through this intermediate. Second, this intermediate is also populated in unfolding traces with an identical stability and length (see arrows in Fig. S2 C and D). Third, a C-terminal 10-amino acid residue truncation mutant exhibited slower folding behavior (Fig. S3). This observation suggests that the intermediate state corresponds to the folding/unfolding of the so-called smaller alpha/beta/alpha subdomain of the M domain (14, 16), comprising residues 444–527. The contour length increase of about 28.4 ± 1.1(SD) nm further supports this interpretation (see SI Structure Sizes and Table S1).
Fig. S2.
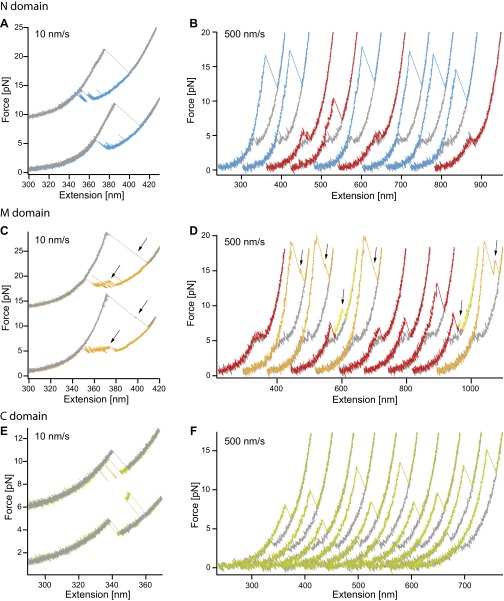
Force-extension cycles of individual domains for different velocities. Force-extension traces of the N domain (A and B), the M domain (C and D), and the C domain (E and F). A, C, and E show cycles of the individual domains at a velocity of 10 nm/s with unfolding traces in gray and refolding traces colored. B, D, and F show cycles at a velocity of 500 nm/s. Here unfolding traces are colored, and refolding traces are in gray. Nonnative unfolding traces occurring for the N and M domain are colored in red. Black arrows as well as the yellow colored parts of the unfolding traces indicate the on-pathway intermediate of the M domain (C and D).
Fig. S3.
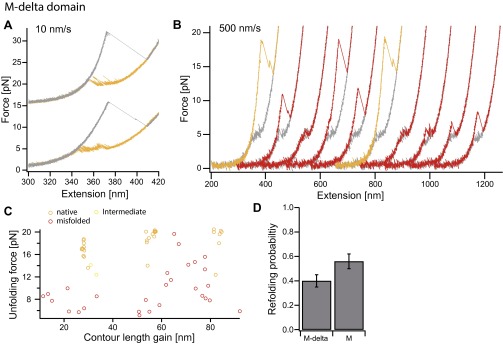
Folding behavior of the C-terminally trancated mutant of the M domain. Force-extension cycles of the M-delta (10 amino acids less at the C-terminal end) construct at a velocity of 10 nm/s (A) and 500 nm/s (B). The on-pathway intermediate observed in the M domain construct seems to be less stable while refolding in slow traces (see Fig. 2B and Fig. S2C). Faster pulled traces that allow probing of the misfolded states rarely populate the intermediate state alone (compare with yellow curves in Fig. S2D). This is also observed in a scatter plot of 46 unfolding traces pulled at 500 nm/s (C); compare to Fig. 2E. (D) Refolding probabilities of force-extension cycles at 500 nm/s for the M-delta and the M domain. The refolding probability is 40 ± 5% for the M-delta domain and 56 ± 6% for the M domain (calculated from probabilities of 10/11 molecules, a total of 304/414 unfolding traces for the M-delta/M domain. Errors are SD). Whether the decreased refolding probability is due to terminal residues that are missing and involved in domain formation or due to a decrease in refolding rate because the spatially close ubiquitin hampers folding is not apparent. However, it is obvious that the folding properties of the intermediate have changed, suggesting that the intermediate results from the small alpha/beta/alpha subdomain at the C terminus of the M domain.
Table S1.
Contour length gains of the individual domains
| Domain (amino acid region) | Distance from crystal structure, nm | Expected length gain, nm | Measured length gain,* nm |
| N domain (2−208) | 6.52 | 69.04 | 70.35 ± 2.06 |
| M domain (273−527) | 6.54 | 86.53 | 85.92 ± 1.68 |
| Intermediate (444−527) | 2.76 | 27.90 | 28.42 ± 1.09 |
| Folded C domain (538−671) | 3.87 | 45.04 | 39.26 ± 1.47 |
| Folded C domain (538−655) | 2.89 | 40.17 | 39.26 ± 1.47 |
Comparison of the measured with the expected contour length gain of the domains and the M domain intermediate. For a discussion, see SI Structure Sizes from WLC Fits.
Errors are SD.
The other transiently populated intermediates we observe in the N domain as well as in the M domain (red arrows in Fig. 2 A and B) do not show similarly well-defined length nor kinetics and likely constitute ensembles of intermediate states.
The slow pulling speed traces shown in Fig. 2 A−C always result in a natively folded domain after relaxation. Faster (500 nm/s) unfolding and refolding cycles give the protein only a short time to refold at low forces and therefore can trap the protein in intermediate states. A series of subsequent fast stretch−relax cycles for the three domains are shown in Fig. S2 B, D, and F. For the N and M domains, we find two possible outcomes: Either the domain has refolded to the native state (green or orange) or it populates one of the intermediate states (red). Scatter plots of mechanical stability vs. contour length gain (Fig. 2 D and E) show a large spread in both stability and contour length increase of the intermediates, further supporting the notion of an ensemble of states rather than well-defined intermediate structures. In contrast, the native states of all three domains, as well as the on-pathway intermediate of the M domain, show clear overlap characteristic of well-defined states. The C domain shows no intermediate states (Fig. 2F), as expected for a two-state folder.
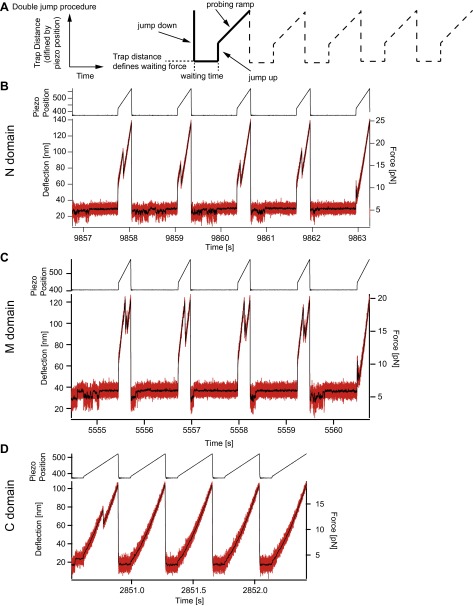
A priori, ensembles of transient intermediate states can comprise on-pathway as well as off-pathway (misfolded) intermediates. For the short-lived states, it is difficult to distinguish between the two from force-extension cycles alone. However, studying the force dependence of the folding kinetics can reveal the nature of the intermediates. In the case of on-pathway intermediates, increasing force should reduce refolding rates, because the population of intermediates will be decreased. In the case of misfolded (off-pathway) states, increasing applied force can increase refolding rates, because a higher load will decrease the population of misfolded states. Inspired by chemical double-jump experiments that are widely used to characterize protein folding pathways (17, 18), we used a mechanical double-jump protocol (19) to study force-dependent refolding. In brief, starting from the unfolded state, we relaxed the polypeptide chain rapidly to a certain low force value, allowing the chain a certain time to refold, then quenched this refolding process by jumping to a force value between 5 pN and 12 pN, from which we started an unfolding force ramp that allowed us to determine the fraction of folded protein in the native state as a function of “waiting force” and “waiting time” (see Fig. S4 and SI Methods). In addition to the unfolding ramp, we can observe the behavior of the domains during the waiting time (Fig. S5).
Fig. S4.
Double jump assay and raw data examples of the individual domains. (A) For well-defined refolding parameters and an easy readout of the protein response, a special force exertion pattern is applied. The completely unfolded peptide is relaxed as rapidly as possible (jump down) to a certain trap distance. From the DNA and protein parameters, the waiting force is calculated. The waiting force is the force that acts on the protein if the protein chain is completely unfolded. After a certain waiting time, the trap distance is increased (jump up) to forces that quench the refolding process but don’t unfold the native structure. In a subsequent probing ramp, the state of the protein is evaluated. (B−D) Example raw data of the double-jump experiments of the N domain (B), the M domain (C), and the C domain (D). From the probing ramps, force-extension traces are calculated and the state of the protein is determined. At high-enough waiting forces during the waiting time, we can directly observe the folding of the molecules (see also Fig. S5).
Fig. S5.
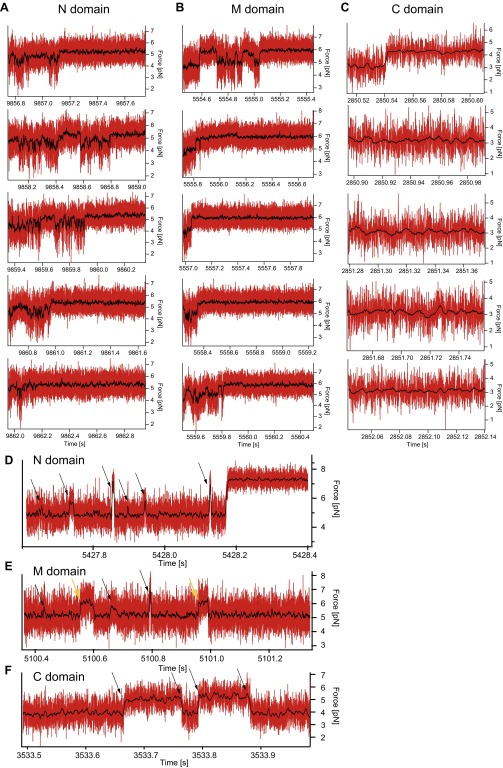
Example force signals during the waiting time of the individual domains. (A−C) Expanded sections of the force signal after the jump down while waiting at low forces (of Fig. S4) of the N domain (A), the M domain (B), and the C domain (C). (A) The population of multiple states with different contour length and timescales during the conformational search for the native state can be directly observed. If the native state (here around 5.4 pN) is reached, the N domain is stable at these forces. However, a stable state is not necessarily the native state, as we observe for the lowermost example trace that doesn’t show a native-like unfolding pattern in the probing ramp (see Fig. S4B). These example data also suggest that conversion between different misfolded states is possible, because different states are populated without visiting the completely unfolded states. (B) The M domain shows heterogenic behavior similar to that of the N domain. Here the native state is stable at around 6 pN. Like in A, the lowermost example trace is trapped in a more stable misfolded state but not in the native state (see Fig. S4C). (C) For the C domain, no additional states with significant contour length changes are observed. (D and E) Force signals of the N domain (D) and the M domain (E) at very high forces. At these forces mainly the completely unfolded state is populated. Arrows mark transitions into intermediate states that show a variety of contour lengths. Yellow arrows are most likely the M domain on-pathway intermediate. (F) Force signal of the C domain over 0.5 s. In contrast to the N and M domains, the C domain can refold and unfold completely (black arrows) at the timescale of the experiment. This is considered in the model describing the refolding behavior of the C domain (see Fig. 2L).
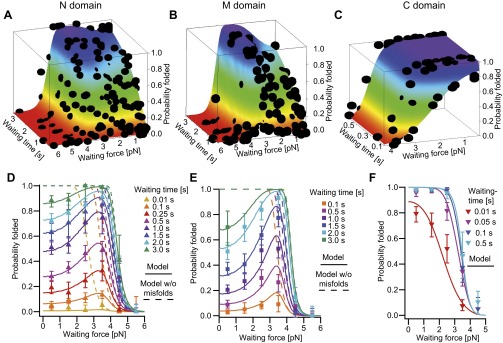
Plots of the force-dependent refolding kinetics are shown in Fig. 2 G−I. At the lowest waiting force measured (orange markers), the N and M domains fold within seconds, and the C domain folds within tenths of milliseconds. Although the C domain (Fig. 2I) exhibits a normal force dependence, where force slows down refolding kinetics, we find a counterintuitive behavior for the N and M domains (Fig. 2 G and H). Here, folding kinetics first become faster with increasing force, and, at forces exceeding about 3.5 pN, folding slows down again. This effect is even more obvious if folding probabilities are plotted against force (Fig. S6 D and E), where the folding probabilities peak at around 3.5 pN. This scenario is described above and identifies the ensemble of transiently populated intermediates as misfolded states.
Fig. S6.
Force- and time-dependent refolding probabilities of the individual domains. (A–C) Measured, nonaveraged refolding probabilities (black dots) depending on waiting time and waiting force of the N domain (A), the M domain (B), and the C domain (C). These data sets are fitted with Eq. S10 for the N and M domain and Eq. S12 for the C domain as detailed in SI Methods. The fits are shown as colored surfaces within the graphs. (D–F) In Fig. 2 D–F, the averaged probabilities are plotted against the waiting time, and the waiting force is color coded. Here the refolding probabilities of the N domain (D), the M domain (E), and the C domain (F) are plotted against waiting force, and the waiting time is color coded. For the N and M domains, a considerable decrease in refolding probability at low forces is observed. Continuous lines are from the fits shown above. Dashed lines are the probabilities that would be expected if the misfolded state ensemble didn’t exist.
A minimal kinetic model depicted in Fig. 2 J and K (Eqs. S8–S10) can quantitatively explain the observed effects. In this model, the unfolded state ensemble is in rapid equilibrium with an ensemble of misfolded, i.e., folding-incompetent, states. The effect of force is twofold: First, it helps the protein to avoid the misfolded states, and, second, it slows down folding from the unfolded to the native state.
The fits of this model to the force- and time-dependent probabilities shown in Fig. 2 G and H depend only on one set of four parameters, namely, the folding rate at zero force with the corresponding force dependence and the equilibrium constant of misfolded states with the corresponding force dependence (see SI Methods and Fig. S6). Even though the ensemble of misfolded states is quite heterogeneous, average parameters describe our results well. We find that the ensembles of misfolded states have an average free energy of 7.3 (± 0.1) kBT for the N domain and 9.9 (± 0.1) kBT for the M domain, consistent with an estimate directly obtained from force-extension traces (Estimate 2). We also find fast folding rates from the unfolded ensemble to the native state at zero load of 954 (± 65) s−1 for the N and 7651 (± 714) s−1 for the M domain. Therefore, the presence of misfolded states reduces the folding rates from thousands per second to about one per second (Fig. 2 D and E). The expected force-dependent refolding probabilities without misfolded states are shown by the dashed lines in Fig. 2 G and H.
Since the C domain exhibits equilibrium two-state behavior, a two-state model (Fig. 2L and Eqs. S11 and S12) describes its folding probabilities well (fits in Fig. 2I and Fig. S6 C and F). Zero-force folding and unfolding rate constants are 218 (± 16) s−1 and 0.154 (± 0.029) s−1, respectively.
Comparing Folding Kinetics of the Hsp90 Monomer and Its Constituting Domains.
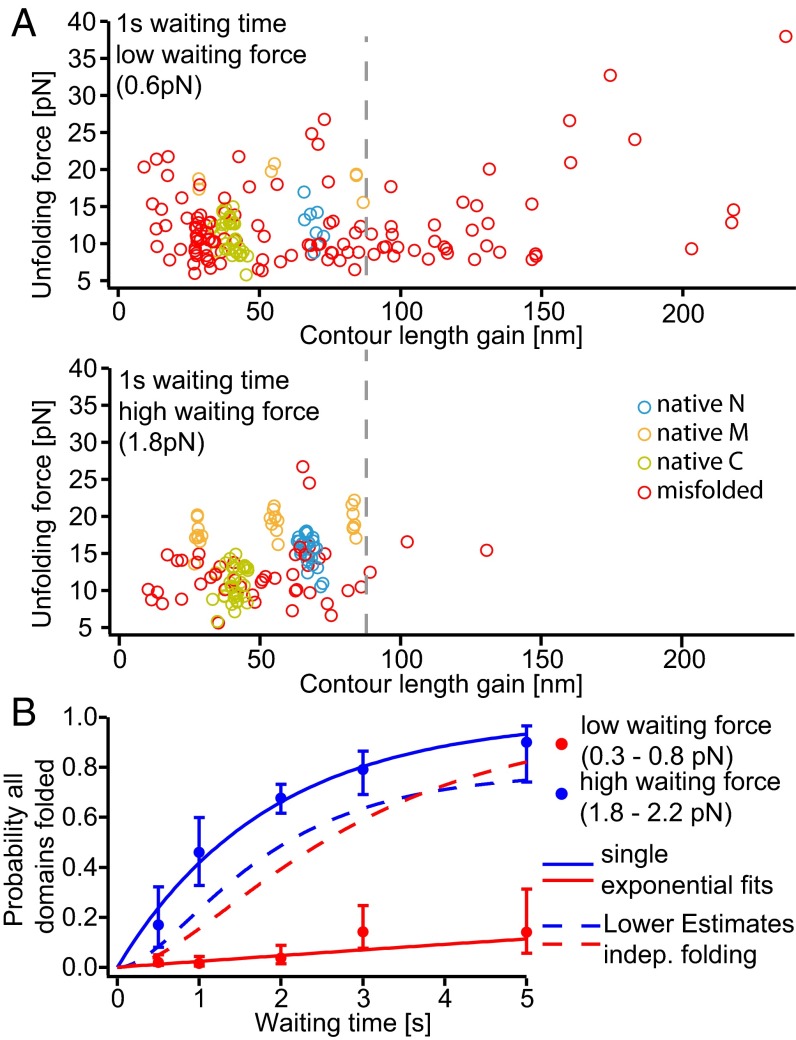
In the following, we investigated whether the overall folding kinetics of the complete Hsp90 monomer can be described from the folding kinetics of the individual domains or whether additional complications further affect folding of Hsp90. Using the jump protocol described above, we classified misfolded conformations and folded domains of the whole monomer in a scatter plot of unfolding force vs. contour length gain (Fig. 3A). At low waiting forces, we find even more misfolded states (red circles) than for the individual domains with both higher stabilities (unfolding force) and larger contour length gains. We hypothesize that the low forces now allow regions of the protein distant in sequence, i.e., across domains, to interact and misfold into stable intermediates. At higher forces, occurrence of intermediates is reduced and, specifically, those intermediates with long contour length gains from distant regions of the protein are suppressed. It can also be seen that higher loads significantly increase the occurrence of natively folded domains (blue, orange, and green circles). Sample traces are presented in Fig. S7 A and B for low and high waiting forces, respectively.
Fig. 3.
Cross-domain misfolds strongly decrease refolding rates of the monomer at low forces. (A) Example scatter plots of double jump refolding experiments with a low (Top) and high (Bottom) waiting force, using the same single Hsp90 monomer (60 and 45 unfolding traces, respectively). Blue, orange, and green circles correspond to unfolding events of the N, M, and C domains (see Fig. 2 D and E). We observe a broad spectrum of nonnative events (red circles). At low forces (Top), many of these misfolds show a longer contour length gain than one would expect from the largest native domain (M domain, ∼68 nm); hence misfolds to the right of the gray dashed lines must involve two or even all three domains. At slightly higher waiting forces (Bottom), misfolds, especially those with longer contour length gain, are greatly reduced. For clarity, the event when the M domain only populates the on-pathway intermediate (∼28 nm, especially at low force) is not assigned. More scatter plots for different waiting times are shown in Fig. S7D. (B) Probability of observing a completely refolded Hsp90 monomer after a double jump experiment, against waiting time. Red and blue dots show averaged probabilities for a low waiting force range (0.3–0.8 pN) and for a high waiting force range (1.8–2.2 pN), respectively. Probabilities were quantified with simple single exponentials (continuous lines), showing that a slightly higher waiting force can greatly improve refolding. We estimated a lower limit from the isolated domain refolding experiments assuming independent folding (see Estimate 4). For higher waiting forces, the lower estimate (blue, dashed line) lies below the measured refolding probabilities, indicating little or no influence of cross-domain misfolds. However, for low waiting forces, the estimate is well above the measured refolding probabilities, showing severe disturbance of refolding by cross-domain misfolds. For this graph, 1,067 monomer traces of 10 molecules were analyzed; example traces, refolding probabilities of the domain itself, and nonaveraged probabilities are shown in Fig. S7 A−C, E, and F. For uncertainties, see SI Methods.
Fig. S7.
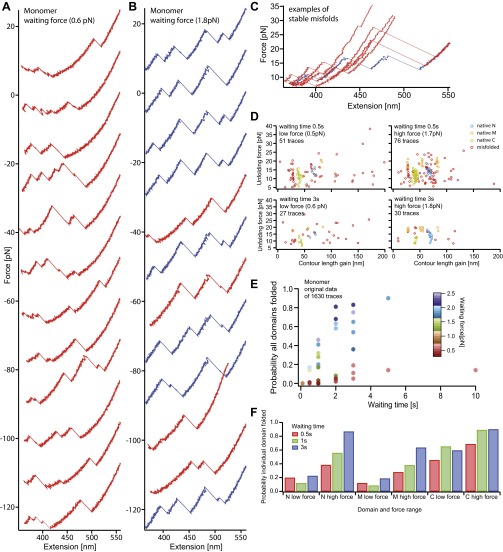
Additional data from double jump experiments of the monomer. (A and B) Successive force-extension traces from double jump experiments at low waiting force (A) and high waiting force (B); completely folded monomers are shown (blue). These example traces are from the same molecule whose scatter plots are shown in Fig. 3A. (C) Examples of very stable misfolds of the monomer after the double jump. Some misfolded structures don’t unfold or unfold at much higher forces than expected. The contour length of these misfolded states often is larger than the single domains. For comparison, a native trace is shown in blue. (D) In Fig. 3A, we show scatter plots at low and high forces after a waiting time of 1 s. Here scatter plots at low (Left) and high (Right) forces, for waiting times of 0.5 s (Top) and 3 s (Bottom) are shown. (E) In Fig. 3B, averaged probability data for low (0.3–0.8 pN) and high forces (1.8–2.2 pN) are displayed vs. waiting time. Here, the raw data are shown that were used for fitting the single exponentials. (F) So far, only the refolding probabilities for the complete monomer were analyzed (Fig. 3B). However, we can also identify the individual domains from the unfolding traces of the monomers (like in the scatter plots). The histogram shows the refolding probabilities of the individual domains for low and high waiting forces for different waiting times of single-example experiments. As expected, we observe more refolding of the N and M domains for higher waiting force and longer waiting times. The folding of the C domain is reduced, if refolded in the monomer construct. From the individual domain data, refolding probabilities of almost 100% are expected. This shows that the C domains also form cross-domain intermediates.
A plot that shows the force- and time-dependent probabilities of complete refolding of the monomer at both low and high forces reveals the drastic effect of cross-domain misfolded states (Fig. 3B). At low waiting forces (0.3–0.8 pN, red), folding is suppressed dramatically compared with high waiting forces (1.8–2.2 pN, blue). Single exponential fits to the data yield 0.024 ± 0.013 s−1 for low waiting forces (Fig. 3B, red line) and 0.54 ± 0.07 s−1 for high waiting forces (Fig. 3B, blue line). A lower-limit comparison with the expected folding kinetics calculated under the assumption of independent folding of the individual domains (dashed lines in Fig. 3B; for details, see Estimate 4) shows that, under low loads, cross-domain intermediates lead to much slower folding than expected from the domains individually.
Folding and Assembly of the Dimer.
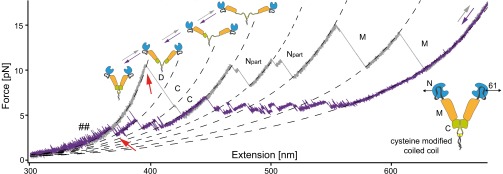
The last step of assembly into a functional Hsp90 machine is the dimerization of two monomer chains. To study folding and assembly of Hsp90, we designed a construct where we link two Hsp90 domains through a C-terminal leucine zipper into a single-chain construct. Cysteine residues within the leucine zipper ensure permanent crosslinking of the two chains. We applied force at the N domains of Hsp90 through cysteines at position 61 (for details, see SI Methods). Fig. 4 shows a force-extension trace of this construct, where the unfolding of all six Hsp90 domains of the dimer can be seen, proving successful construct design.
Fig. 4.
Dimerization of the Hsp90. Force-extension traces of the Hsp90 dimer, unfolded (gray) and refolded (purple) at a velocity of 10 nm/s. Mechanically stable dimers are engineered using a C-terminal coiled coil motif carrying cysteines (see lower right-hand Inset). Force (black arrows) is applied at amino acid positions 61; hence only a part of the N domain is measured, and an additional intermediate is observed (see also legend of Fig. S8). In addition to the duplication of the unfolding events, a high force peak is observed, at the start of the trace in this case (D). This peak (red arrow on gray trace) is due to the dimerization of the C domains. After dissociation, the unstructured regions of both C domains are stretched, and both C domains unfold rapidly. After successful refolding of all domains, the dimerization event is seen (red arrow on purple trace). The unfolding and refolding pathway is shown in a sequence of Insets.
An additional unfolding event that is not observed for the monomer reflects the dissociation of the dimer. After dissociation at around 10 pN (red arrow on gray trace), the unstructured portions of the C domains are stretched. The C domains are stabilized by the dimerization, and, after dissociation, the C domains unfold rapidly. Upon relaxation of the unfolded dimer chain, we see folding of all six domains and, as a final event, dimerization of the fully folded chain at about 3 pN (red arrow on purple trace). More dimer traces are shown in Fig. S8.
Fig. S8.
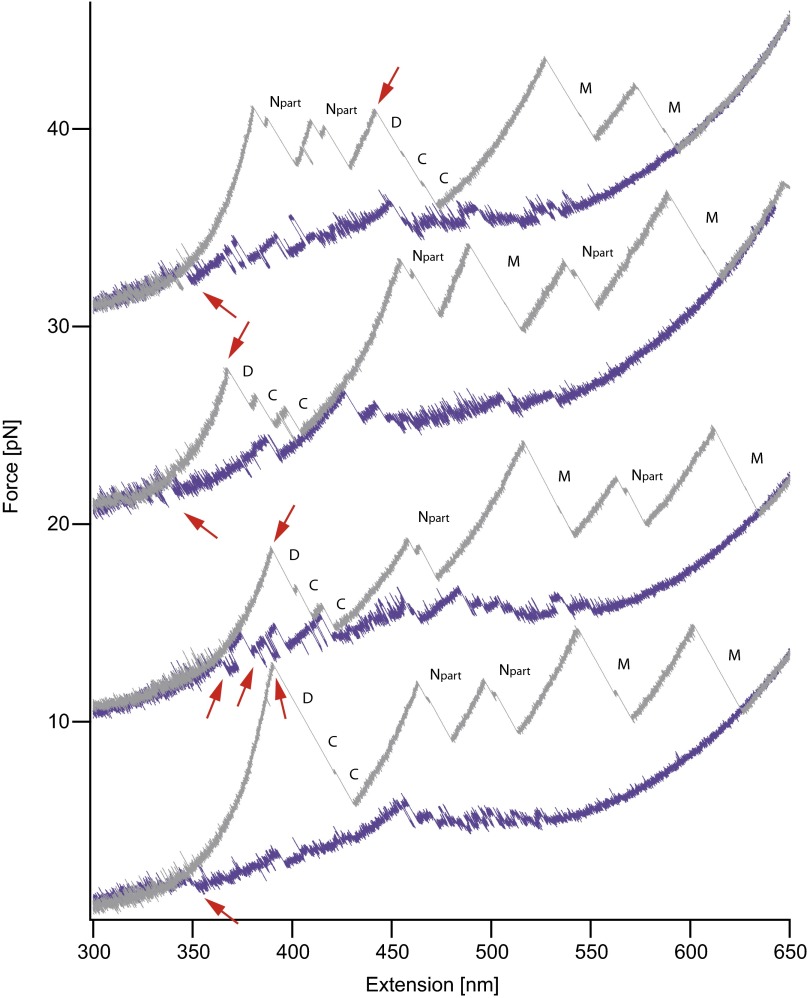
Additional dimer force-extension traces with identical conditions to that shown in Fig. 4. Each stretch and relax cycle is of a different molecule. We always observe dimer dissociation in unfolding traces, as well as association in refolding traces (red arrows). In the first trace, both of the N domains unfold before the dimer is separated. The shortened N domain (Npart) is due to pulling at amino acid positions 61. In this pulling geometry, an intermediate in the N domain is populated. The same contour length gain and intermediate were also observed in a monomeric construct pulled at residues 61 and 560. Traces are shown in the supplement of ref. 13.
The contour length change upon dissociation of the dimer is about 40.6 ± 1.1 nm, which matches the elongation of the unstructured parts at the C terminus plus about 12 nm of additional residues, likely from the four-helix bundle (see SI Structure Sizes and Table S2). We can exclude significant contributions from the N domains to the dimer stability because, before domain dissociation, we observe the opening fluctuations of the two charged linkers (see “##” in Fig. 4). Therefore, the N and M domains are already spatially separated when the dimer dissociates.
Table S2.
Contour length gains of the dimer opening event
| Unstructured part C domains (amino acid region) | Distance from crystal structure, nm | Expected length gain, nm | Measured length gain,* nm |
| Residues 675–715 (C terminal helix stable) | 0.8 | 29.1 | 40.56 ± 1.06 |
| Residues 656–715 (C terminal helix unstable) | 1.7 | 41.4 | 40.56 ± 1.06 |
Comparison of the measured with the expected contour length gain of the dimer opening event for two scenarios. In the first, the last C-terminal alpha helix is considered to be stable; in the second, it is considered unstable in the not dimerized state. For a discussion, see SI Structure Sizes from WLC Fits.
Errors are SD.
Discussion
Folding of the Individual Domains.
The organization of proteins into domains is a common feature that has been recognized as key in facilitating folding and self-assembly (20). We find that all three domains of Hsp90, when held in isolation, fold rapidly and independently. The smallest and weakest C domain (117 residues folded) folds in a two-state-like manner with a folding rate constant kU→F of 220 s−1 without noticeably populating misfolded states. However, the folding kinetics of the larger N and M domains, even though they fold within 1 s, are dominated by misfolded intermediates. As detailed, we find considerable free energies for the misfolded states of 7.3 ± 0.1 kBT and 9.9 ± 0.1 kBT as well as lower limits for kU→M of 12,600 s−1 and 40,000 s−1 for the N and M domains, respectively, which suggests an extremely fast population of misfolded states. This is supported by the observation that neither the N nor the M domain ever populates the completely unfolded state after fast relaxation of the chain (Fig. S2 B and D). The productive folding rate constant kU→F is very fast for both the N (954 ± 65 s−1) and the M (7,651 ± 714 s−1) domains. Given the large size of the M domain, the folding rate of 7,700 s−1 may appear very fast. However, the M domain exhibits a simple architecture with a low relative contact order of 0.05 rationalizing fast folding of this domain (2). Note that a similar competition between distinct misfolding intermediates and folded states that can be modulated by force has been reported in single-molecule experiments with the calcium binding proteins NCS-1 (4) and Calmodulin (9). Likely owing to the large sizes of our N and M domains (211 and 266 residues, respectively), the population of misfolded states is more heterogeneous than in those simpler proteins. The large heterogeneity is reflected both in the large spread of lengths and unfolding forces of the scatter plots in Fig. 2 D and E and in the individual refolding time traces of Fig. S5. Structurally similarly heterogeneous burst-phase intermediates have been inferred from bulk studies of other large proteins like maltose-binding protein (MBP) and Tim barrel protein (6, 21).
Cross-Domain Misfolds.
The most striking result of our study is the strong decrease of the overall folding speed when the three Hsp90 domains are linked in one chain forming the 709-amino acid monomer. Clearly, the folding energy landscape is significantly altered. This has previously been observed for protein chains consisting of identical or homologous subunits such as the long immunoglobulin domain chains of the muscle protein titin (8, 22), fibronectin (23), or ubiquitin (24).
We find that misfolded states occur across domains in a long protein even if the domains share no homology. In a protein chain of increasing length and stability, misfolding will be inevitable, even if the subunits have no common fold. In a short single-domain protein, it may be possible to optimize the sequence for a smooth energy landscape without misfolded states of significant free energy as we find for the C domain of Hsp90. However, as the chain length grows, so the number interactions stabilizing misfolded states will increase (25), eventually trapping the protein on its way to the native state. Hence, even if all subdomains can fold rapidly, the mere fact that they are linked in one chain will slow their folding. This is precisely what we find in our Hsp90 monomer. The misfolded states that we find in the large N and M domains already reduce the effective folding time to seconds. However, when integrated into the full chain of the monomer, new cross-domain misfolds slow folding even more dramatically (Fig. 3). Although, for the individual domains, the misfolded states are very dynamic, we often observe states that show high mechanical stability for the full monomer, some of them exceeding our accessible force range of 40 pN (Fig. S7C), underscoring the detrimental effects of those cross-domain intermediates on folding. Such cross-domain misfolds are likely a general feature of large proteins and therefore limit refolding rates.
Hsp90 Dimer Assembly.
After full folding of the monomer has been completed, the two chains have to find each other and form a stable dimer. In our dimer refolding traces, we can observe the formation of the dimer directly in the refolding traces after all of the domains have folded (Fig. 4). In the nucleotide-free state, dimerization of yeast Hsp90 is mainly achieved by association of the C domains (26), as we can rule out significant contributions from N-terminal dimerization.
Chaperoning by Force.
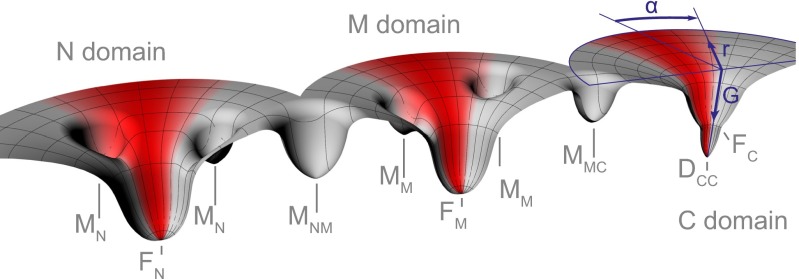
An immediate conclusion that can be drawn from our experiments is that small mechanical forces can stretch out the unfolded chain and thus prevent misfolding interactions between distant parts of the protein chain. This leads to the, at first sight paradoxical, effect that full-length Hsp90 as well as its large N and M domains fold faster if small forces are applied (Figs. 2 G and H and 3B). Force speeds up folding in the isolated N and M domains by a factor of 2 or 3, whereas, for the full-length chain, we find a factor of 25 when increasing the force from ∼0.5 pN to ∼2.5 pN. This observation can be visualized in a simplified energy landscape diagram (27). The red shaded areas in Fig. 5 show a restriction of the ensemble of accessible folding pathways by force. This prevents the formation of misfolds involving distant parts of the chain, thus chaperoning the chain toward the folded states of its subunits.
Fig. 5.
Simplified energy landscapes for folding and assembly of Hsp90. The folding properties of Hsp90 can be described by three individual energy landscapes, because the individual domains don’t directly stabilize each other. Experiments using the individual domains showed that the N and the M domain have a fast productive folding pathway to the native states (FN, FM) but that the overall folding rate is greatly slowed down by off-pathway intermediates (MN, MM). The C domain exhibits two-state behavior without kinetic traps. Refolding of the full-length monomer showed heterogeneous and stable cross-domain misfolds (MNM, MMC). A cylindrical coordinate system shown for the C domain (blue) applies for all domains. G refers to free energy. The inverse of the radial coordinate r describes the overall number of residues with native conformation. The inverse of the absolute value of the angular coordinate α can be interpreted as the average distance between residues in misfolded conformations. This distance is strongly dependent on force and restricts the conformational search (red shaded areas), speeding up folding by avoiding or depopulating misfolded species. This effect is particularly strong for the cross-domain misfolds in the full-length monomer. After successful formation of the C domain, Hsp90 can dimerize into a functional chaperone (DCC).
Cotranslational folding has been recognized as an important feature for productive protein folding for a long time (28). The sequential way protein chains are synthesized at the ribosome allows the cell to avoid cross-domain misfolding. We show that a similar goal can also be achieved by force application to the ends of a large protein. In a scenario where Hsp90 folds cotranslationally in vivo, misfolding will therefore be largely avoided. After initial folding of Hsp90 when translation has been accomplished, individual domains or subdomains may transiently unfold and refold under heat shock conditions, but a situation where the whole chain is unfolded is very unlikely to occur again.
Reversing misfolding by actively applying force is also discussed for chaperones, like GroEL/GroES (29). Another mechanism for chaperones to avoid cross-domain misfolding is the stabilization of partially folded, aggregation-prone intermediates. This has been shown for trigger factor on the single-molecule level chaperoning an individual MBP as well as a four-times repeat construct thereof (30).
Methods
Proteins are attached to beads in a multistage reaction. First, small (34 base pairs), maleinimide-modified DNA oligonucleotides are coupled to the free cysteines of the proteins (13). These DNA oligonucleotides are then hybridized with long (545 base pair) DNA handles by a single-stranded overhang on one end that is complementary to the DNA oligonucleotides (9). At the other end, DNA handles are functionalized with biotin or digoxigenin, which in turn can bind to streptavidin-coated or anti-digoxigenin-coated 1-µm silica beads (9, 13). For trapping of beads, we use a custom-built, dual-trap optical tweezers setup with back-focal plane detection and high resolution as described previously (31). The trap stiffnesses of the individual traps are adjusted to around 0.3 pN/nm, and acquisition frequency is 20 kHz or 30 kHz. The temperature at the position of the protein is ∼30 °C. All experiments are performed in a buffer containing 40 mM Hepes, 150 mM KCl, 10 mM MgCl2, pH 7.4. To avoid photo damage, a scavenger system comprising glucose, glucose oxidase, and glucose catalase or trolox is used (13). A detailed description of methods used is given in SI Methods.
SI Methods
Protein Constructs and Production.
All Hsp90 mutants originate from yeast Hsp90 (Hsp82), and numbering refers to yeast Hsp90 wild type. Plasmids encoding the mutants were prepared by standard molecular biology techniques or ordered from Genescript. Proteins were recombinantly expressed in BL21DE3 cod+ (Stratagene) Escherichia coli strain and purified as described in ref. 13.
Single-domain constructs and the full-length construct are expressed as fusion constructs with one N-terminal and one C-terminal ubiquitin. The ubiquitins serve as spacers and have free cysteine residues for DNA coupling (9). The C-terminal ubiquitin has a C-terminal His-tag for purification. The N-domain construct contains amino acids 1–211 of Hsp90, the M domain contains amino acids 273–537, the C-terminally truncated M domain (M-delta) contains amino acids 273–527, the C domain contains amino acids 527–709, and the full-length monomer contains all amino acids (1−709).
For the dimer construct, Hsp90 is expressed as a fusion protein with an N-terminal SUMO protein and a C-terminal alpha helix, which can form a coiled coil. The SUMO protein has an N-terminal His-tag and is cleaved during purification, providing a tag-free Hsp90 construct. The coiled coil that forms upon Hsp90 dimerization enhances the dimer stability and is described in ref. 32. The coiled coil alone is not enough to achieve mechanical stability in our experiments. It has been shown that it dissociates at around 10 pN in mechanical experiments (33). Therefore, we introduced an additional cysteine mutation at the first (N-terminal) a-position of the coiled coil. After coiled coil formation, the cysteines of each helix are in close spatial proximity, disulfide bond formation is strongly favored, and covalently linked Hsp90 monomers are obtained. The position of the cysteines for oligo attachment is critical, because the cysteines in the coiled coil have to react faster than the cysteines for oligo attachment. Therefore, force is exerted at both N domains via cysteines at amino acid positions 61, which are far apart in the crystal structure.
Experimental Patterns: Cycles and Double Jump Experiments.
In our assay, force is applied by moving a bead held in the mobile trap using a piezo mirror with respect to a bead held in the fixed trap. A typical force exertion pattern, referred to as an unfolding−refolding (stretch and relax) cycle, is obtained by moving the beads apart and together with constant velocity and monitoring the force signal. From this, the force-extension traces are calculated.
During unfolding−refolding cycles, the protein is exposed to different forces; thus studying refolding behavior with defined parameters is difficult. To address this, we apply a different protocol, the double jump (see also Fig. S4A). Here, we first relax the unfolded peptide to a certain trap distance. For this trap distance, we calculate (using DNA and protein parameters) the “waiting force,” that is, the force that would act on the completely unfolded protein. After a certain “waiting time” spent at this trap distance, the trap distance is increased by a second jump, resulting in a medium force, quenching the refolding process but not unfolding native structures. The jumps themselves take less than 10 ms, dependent on the distance traveled. A subsequent unfolding ramp at a constant velocity reports on the state of the protein after the double jump. This unfolding ramp is especially useful when studying proteins with multiple structural units, like the Hsp90 monomer, because multiple and different unfolding events can be classified easily. In addition to the unfolding ramp, we can also observe the behavior of the protein during the waiting time in passive mode (force fluctuations at constant trap position; see Fig. S5). By counting the native refolding events at different waiting times and waiting forces, 3D refolding probability data (see graphs in Fig. S6 A−C) are obtained.
Classification of Unfolding Events.
For detailed datasets, many traces (>6,000 double-jump traces per construct) are analyzed. To cope with the amount of data, we automate the classification. Briefly, after extraction, the unfolding force-extension traces are transformed into protein contour length space by eliminating the contribution of the DNA handles. Individual protein contour lengths vs. trap distance traces are binned into histograms and analyzed using a peak finding routine (Igor Pro; Wavemetrics). Length gains are obtained from the length differences between the peaks. The associated unfolding forces are extracted by finding the unfolding transitions in the individual force-extension trace. Events that match the native contour length gain (±5 nm) and unfolding force distributions (mean force ±7 pN) are preclassified as native.
Then, all traces are checked manually by laying them on top of each other, because misfolded states can lie within the contour length gain and unfolding force tolerance. Also, some subtle features that are present in the native fold are absent in traces that have native-like contour length gains and unfolding forces. One of these features is the flipping (rapid opening and closing of small structures under force) before the unfolding of the N and the M domains (see Fig. S2 A and C unfolding traces shortly before unfolding). For all three domains, we also rarely observe that the molecules don’t refold for several consecutive cycles, at waiting forces and waiting times where productive refolding is expected. The reason may be isomerization of proline residues. Traces that didn’t show the full native pattern or showed no refolding at productive conditions for many successive traces were sorted out.
The M domain has three different native unfolding events in the scatter plots shown in Figs. 2E and 3A. If the M domain is unfolded, it always passes through the unfolding intermediate (see Refolding of the Individual Domains). Depending on the lifetime, the classification algorithm either picks up the intermediate and two unfolding events for the M domain or the intermediate isn’t stable enough and one unfolding event, with larger contour length, is observed.
To clarify the original, 3D refolding probability data shown in Figs. S6 A−C and S7E, it is averaged and reduced to two dimensions, shown in Figs. 2 G−I and 3B and Fig. S6 D−F. The individual domains refolding probabilities are averaged by combining all data within a waiting force range of 1 pN. Error bars are calculated using the Clopper−Pearson confidence interval (95%) to estimate the error of limited statistics. For the individual domains, an additional statistical error to estimate the effect of wrong force calibration is added. This error is calculated from the probability change we expect for a 0.2-pN (divided by the square root of individual data points) force shift.
All force-extension traces displayed are filtered with a sliding average of 201 points for 10 nm/s and 51 points for 500 nm/s traces.
Data Modeling.
The force-extension F(x) relation of the DNA handles dependent on the thermal energy kBT, the DNA persistence length pD, the DNA contour length LD, and the elastic stretch modulus K can be described by the extensible WLC interpolation equation (eWLC),
| [S1] |
Similarly, the force-extension relation of an unfolded amino acid chain dependent on the protein contour length LP and protein persistence length pP can be described using a WLC model.
| [S2] |
Energies and rates at zero force between different protein states can be calculated from the data considering an energetic model for the complete system, comprising beads, DNA, and unfolded protein (Berkemeier Schlierf model) (34). The total free energy Gi(F) at a certain force is the sum of the energy of the protein Ei in the state i, the energy of the bead displacement in the harmonic trap potential , the energy of the DNA linker (see Eq. S1), and the energy of the potentially unfolded peptide (see Eq. S2).
| [S3] |
For a fixed trap distance, the protein state defines the force. If the protein changes its state and this state change is associated with a contour length change (for example, folding or unfolding), the energy difference of the complete system can be written as
| [S4] |
In equilibrium, the force-dependent probabilities are related to the energy difference between two protein states. The ratio of the probabilities between two protein states and is defined by the Boltzmann distribution,
| [S5] |
For a two-state system, where , this can be written as
| [S6] |
Similarly, the force dependence of transition rates between two states and can be described by the free energy difference between the initial and the transition state .
| [S7] |
This equation allows determination of the rate at zero force as well as the transition state position that is linked to .
Model for the N and M Domains.
To quantitatively describe the refolding probability depending on the waiting force and waiting time we assume a three-state model (see also Fig. 2 J and K). The unfolded (U) and the misfolded (M) state ensembles are at equilibrium and separated by an energy . Folding into the folded state (F) can just occur from the unfolded state ensemble (U). The unfolding rate from the native state (F) to the unfolded state (U) is neglected because we never observe unfolding at the forces and at the timescale of the refolding experiment (see Figs. 1 and 2 and Fig. S2).
The probability of being in the unfolded state is defined by Eq. S6. (see Eq. S4) is the energy difference of the protein between the unfolded and misfolded states, and is the energy difference of the whole system. The contour length difference between these states, , relates the difference between and .
| [S8] |
The force-dependent folding rate from the unfolded states to the native state can be written similarly to Eq. S7,
| [S9] |
Together with Eqs. S8 and S9, the expression for the probability of being in the folded state after a certain waiting time and waiting force is
| [S10] |
To calculate the energy contributions of the beads, the DNA, and the unfolded protein at different forces, we take DNA and protein parameters from WLC fits to unfolding cycles. For each protein, before double-jump experiments, we determine these parameters. To fit the whole 3D dataset, we use averaged DNA and protein parameters from different molecules.
Average parameters for the N domain are , , , , , folded contour length , unfolded contour length , and combined trap stiffness = 0.176 pN/nm.
Eq. S10 is fitted to the force- and time-dependent probability data of the N domain (Fig. S6A) with and as fitting parameters. Fixing the contour length of the misfolded states to and the position of the transition state (U→F) to results in the lowest value of χ2.
Average parameters for the M domain are , , , , , folded contour length , unfolded contour length , and combined trap stiffness = 0.174 pN/nm.
Eq. S10 is fitted to the force- and time-dependent probability data of the M domain (Fig. S6B) with and as fitting parameters. Fixing the contour length of the misfolded states to and the position of the transition state (U→F) to results in the lowest value of χ2.
Errors for the misfolding energy and the folding rate shown in the manuscript are obtained from the fits. These errors don’t account for systematic errors in force calibration and DNA parameters. Therefore, the actual error might be higher. Typically, a 10% error for energies and an error of one order of magnitude for rates can be expected (9).
It is important to note that the model we use is a simplification of the complicated folding process. The ensemble of misfolded states may well include states that slowly exchange with the native state. Moreover, the unfolded state ensemble may well contain some prestructured parts, and the folding step U → F may contain a rapid sequence of on-pathway intermediates such as, for example, the on-pathway intermediate that we identified for the M domain. Despite its simplicity, the model successfully describes the complete force dependent folding process of the N and M domains using only four parameters each. The rate from the folded state (F) to the unfolded state (U) could be included in the model, but it is not necessary for the N and M domains, as explained above.
Model for the C Domain.
The C domain behaves like a two-state folder; therefore, we assume a folded F and an unfolded state U. Unlike the N and M domains, the C domain can also unfold at forces of interest; therefore, we can’t neglect unfolding from the folded state (see also Fig. S5F). The folding rate and the unfolding rate are as described in Eq. S9.
| [S11] |
Knowing the contour length of the folded and unfolded state, we can transform to for the last equation and calculate the probability to observe the folded C domain after a certain waiting time t at a waiting force .
| [S12] |
Similarly to the other domains, DNA and protein parameters are obtained by fitting unfolding cycles before double jump measurements. We get , , , , , folded contour length , unfolded contour length , and combined stiffness = 0.177 pN/nm.
For a two-state folder, the same transition state position for unfolding and refolding is expected. The constraint that the sum of and matches the contour length gain is considered in the fit. Eq. S12 was fitted to the refolding probability data in Fig. S6C, with a zero load folding rate and unfolding rate as fit parameters. Fixing the position of the transition state to gave the lowest value of χ2.
SI Estimates
To check the plausibility of our results, we used several simple estimates.
Estimate 1: Refolding Rate of the Monomer.
Thirty-six percent of the molecules are completely refolded in stretch and relax cycles at a velocity of 500 nm/s (see Fig. S1). Assuming folding sets in at an extension of 450 nm and the molecule is relaxed to an extension of 200 nm, the molecule spends about a second at the force where refolding is possible (in this force range, the trap distance can be approximated as the extension). Naively assuming two-state kinetics without any force dependence, the folding probability is . For = 0.36 and t = 1 s, the refolding rate is 0.45 s−1, hence the complete monomer folds in ∼2.2 s.
Estimate 2: Energy of N-Domain Misfolds.
We used quantitative models to determine the equilibrium free energy between misfolded and unfolded states for the N and M domains. Because we see the misfolds directly in slowly pulled cycles (Fig. 2 A and B and Fig. S2 A and C), we can estimate the energy directly. We observe the fluctuations at about 4 pN with an extension change of 10 nm. Thus, we estimate the energy E = 4 pN × 10 nm = 40 pNnm = 9.8 kBT, which agrees well with the values obtained from the model.
Estimate 3: Minimal Rates from and to the Misfolded States.
Passive mode traces like in Fig. S5 show force fluctuations of the N domain before complete refolding. The lifetime of the unfolded state is ∼5 ms (=200 s−1) at 3.8 pN. Using Eq. S7 with DNA parameters for the N domain (see Model for the N and M Domains) and assuming a lower limit for the transition state position of 22 nm (counted from unfolded protein), we can extrapolate to zero force. This gives a lower limit for the misfolding rate of about kU→M = 12,600 s−1. Using kU→M/kM→U = exp(EM/kBT) gives a lower limit for the “misunfolding” rate of kM→U = 8.5 s−1.
This kind of estimate is more difficult to do for the M domain because the on-pathway intermediate and the misfolded states mix. However, the estimate can be made using a different approach. The force- and time-dependent probabilities in Fig. 2 D and E show no significant deviation from our fits (solid lines). These fits are all single exponentials, meaning that the misfolded and unfolded states are already in equilibrium for waiting times of at least 0.5 s. Therefore, the misfolding and misunfolding rate (kM→U) must be both greater than 2 s−1. Using kU→M/kM→U = exp(EM/kBT) with the previously obtained equilibrium energies (7.3 kBT and 9.9 kBT for the N and the M domains, respectively), we can estimate the misfolding rates kU→M of >2,960 s−1 for the N domain and >40,000 s−1 for the M domain.
Estimate 4: Lower Estimates for Monomer Refolding Probabilities Using Measured Rates from Individual Domains.
To compare the refolding probabilities of the individual domains to that of the Hsp90 monomer, we calculated a lower estimate assuming the independent folding of individual domains. In Fig. 3B, we showed averaged data between 0.3 pN and 0.8 pN (low waiting force) and data between 1.8 pN and 2.2 pN (high waiting force). During the waiting time, the trap distance is fixed. While the protein folds, its length decreases, and therefore the applied force increases. We can calculate the maximum force that is accessible to the molecule (by refolding), taking average DNA and protein parameters. At low waiting forces, the molecule can access the force range from 0.3 pN to 0.99 pN, whereas, at high waiting forces, the molecule can access the force range from 1.8 pN to 3.13 pN. Assuming independent folding of the domains, the folding probability can be written as the product of the individual domains . For lower estimates at low and high waiting forces, we take the minimal probability of the single-domain models in the accessible force region. The lower estimates were calculated from for low waiting forces and for high waiting forces.
SI Structure Sizes from WLC Fits
Individual Domains.
To characterize the size of the individual domains, unfolding traces of the individual domain constructs at a pulling speed of 500 nm/s (as shown in Fig. S2 B, D, and F) were fitted with WLC models. We globally fitted an eWLC (Eq. S1) in series with one or two WLCs (Eq. S2). For the global fit, the protein persistence length pP was fixed to 0.7 nm, and the elastic stretch modus of the DNA was fixed between 350 pN and 700 pN. To account for the unfolded portion of the C domain, we assumed an additional contour length gain of 22 nm. We obtain average DNA persistence lengths pD of about 15 nm and DNA contour lengths of about 375 nm. The obtained contour lengths gains for the N, M, and C domains as well as the contour length for the M domain on-pathway intermediate are shown in Table S1. The displayed values are averages from 158 traces (11 molecules) for the N domain, 176 traces (8 molecules) for the M domain, and 174 traces (7 molecules) for the C domain.
The contour length gain of the individual unfolding events can be compared with the number of amino acids folded, . Taking the distance, between the first and the last amino acid of the folded part from the crystal structure and assuming a length of = 0.365 nm per residue, we can calculate the expected contour length gains, with . The expected contour length gains for the domains are compared to the measured ones in Table S1: The contour length gain of the C domain resolved in the dimeric crystal structure (residues 538–671) is about 5 nm shorter than expected. If the last alpha helix (residues 656–671) is not folded for the isolated domain, the contour length gain fits within the error. This assumption is substantiated by the unfolding contour length gain we measure for the dimeric construct (see Dimer Dissociation Event).
Dimer Dissociation Event.
The dimer unfolding event (Fig. 4) is fitted as described in Individual Domains, assuming 60 nm of unstructured/unstable contour length that can be approximately accounted for by the unfolding of the two charged linkers. After dimer dissociation, the contour length increases by 40.56 ± 1.06 nm (SD). This value is calculated from seven slowly pulled (10 nm/s or 20 nm/s) traces, where the lifetime of the C domain is long enough for fitting. The contour length gain observed is due to stretching of the unfolded regions at the C terminus that are load-free in the dimerized construct. The cysteines that link the monomers covalently are six amino acids after the C-terminal end of the wild-type protein, at position 715. As already hypothesized above, the unresolved amino acids of the crystal structure cannot explain the contour length observed. However, if the last alpha helix is unstable when in the undimerized state, the measured length gain fits the expected length gain very well (see Table S2).
Acknowledgments
We thank Marco Grison and Katarzyna Tych for comments on the manuscript, Alena Dudarenka and Matthias Jahn for help with graphics, and the German Research Foundation for financial support (SFB863 A4).
Footnotes
The authors declare no conflict of interest.
This article is a PNAS Direct Submission.
This article contains supporting information online at www.pnas.org/lookup/suppl/doi:10.1073/pnas.1518827113/-/DCSupplemental.
References
- 1.Chung HS, Piana-Agostinetti S, Shaw DE, Eaton WA. Structural origin of slow diffusion in protein folding. Science. 2015;349(6255):1504–1510. doi: 10.1126/science.aab1369. [DOI] [PMC free article] [PubMed] [Google Scholar]
- 2.Ivankov DN, et al. Contact order revisited: Influence of protein size on the folding rate. Protein Sci. 2003;12(9):2057–2062. doi: 10.1110/ps.0302503. [DOI] [PMC free article] [PubMed] [Google Scholar]
- 3.Shank EA, Cecconi C, Dill JW, Marqusee S, Bustamante C. The folding cooperativity of a protein is controlled by its chain topology. Nature. 2010;465(7298):637–640. doi: 10.1038/nature09021. [DOI] [PMC free article] [PubMed] [Google Scholar]
- 4.Heidarsson PO, et al. Direct single-molecule observation of calcium-dependent misfolding in human neuronal calcium sensor-1. Proc Natl Acad Sci USA. 2014;111(36):13069–13074. doi: 10.1073/pnas.1401065111. [DOI] [PMC free article] [PubMed] [Google Scholar]
- 5.Yu H, et al. Direct observation of multiple misfolding pathways in a single prion protein molecule. Proc Natl Acad Sci USA. 2012;109(14):5283–5288. doi: 10.1073/pnas.1107736109. [DOI] [PMC free article] [PubMed] [Google Scholar]
- 6.Walters BT, Mayne L, Hinshaw JR, Sosnick TR, Englander SW. Folding of a large protein at high structural resolution. Proc Natl Acad Sci USA. 2013;110(47):18898–18903. doi: 10.1073/pnas.1319482110. [DOI] [PMC free article] [PubMed] [Google Scholar]
- 7.Brockwell DJ, Radford SE. Intermediates: Ubiquitous species on folding energy landscapes? Curr Opin Struct Biol. 2007;17(1):30–37. doi: 10.1016/j.sbi.2007.01.003. [DOI] [PMC free article] [PubMed] [Google Scholar]
- 8.Borgia MB, et al. Single-molecule fluorescence reveals sequence-specific misfolding in multidomain proteins. Nature. 2011;474(7353):662–665. doi: 10.1038/nature10099. [DOI] [PMC free article] [PubMed] [Google Scholar]
- 9.Stigler J, Ziegler F, Gieseke A, Gebhardt JC, Rief M. The complex folding network of single calmodulin molecules. Science. 2011;334(6055):512–516. doi: 10.1126/science.1207598. [DOI] [PubMed] [Google Scholar]
- 10.Greenleaf WJ, Frieda KL, Foster DA, Woodside MT, Block SM. Direct observation of hierarchical folding in single riboswitch aptamers. Science. 2008;319(5863):630–633. doi: 10.1126/science.1151298. [DOI] [PMC free article] [PubMed] [Google Scholar]
- 11.Nunes JM, Mayer-Hartl M, Hartl FU, Müller DJ. Action of the Hsp70 chaperone system observed with single proteins. Nat Commun. 2015;6:6307. doi: 10.1038/ncomms7307. [DOI] [PubMed] [Google Scholar]
- 12.Puchner EM, Gaub HE. Exploring the conformation-regulated function of titin kinase by mechanical pump and probe experiments with single molecules. Angew Chem Int Ed Engl. 2010;49(6):1147–1150. doi: 10.1002/anie.200905956. [DOI] [PubMed] [Google Scholar]
- 13.Jahn M, et al. The charged linker of the molecular chaperone Hsp90 modulates domain contacts and biological function. Proc Natl Acad Sci USA. 2014;111(50):17881–17886. doi: 10.1073/pnas.1414073111. [DOI] [PMC free article] [PubMed] [Google Scholar]
- 14.Ali MM, et al. Crystal structure of an Hsp90-nucleotide-p23/Sba1 closed chaperone complex. Nature. 2006;440(7087):1013–1017. doi: 10.1038/nature04716. [DOI] [PMC free article] [PubMed] [Google Scholar]
- 15.Jakob U, et al. Structural organization of procaryotic and eucaryotic Hsp90. Influence of divalent cations on structure and function. J Biol Chem. 1995;270(24):14412–14419. doi: 10.1074/jbc.270.24.14412. [DOI] [PubMed] [Google Scholar]
- 16.Meyer P, et al. Structural and functional analysis of the middle segment of hsp90: Implications for ATP hydrolysis and client protein and cochaperone interactions. Mol Cell. 2003;11(3):647–658. doi: 10.1016/s1097-2765(03)00065-0. [DOI] [PubMed] [Google Scholar]
- 17.Brandts JF, Halvorson HR, Brennan M. Consideration of the possibility that the slow step in protein denaturation reactions is due to cis−trans isomerism of proline residues. Biochemistry. 1975;14(22):4953–4963. doi: 10.1021/bi00693a026. [DOI] [PubMed] [Google Scholar]
- 18.Wildegger G, Kiefhaber T. Three-state model for lysozyme folding: Triangular folding mechanism with an energetically trapped intermediate. J Mol Biol. 1997;270(2):294–304. doi: 10.1006/jmbi.1997.1030. [DOI] [PubMed] [Google Scholar]
- 19.Schwaiger I, Schleicher M, Noegel AA, Rief M. The folding pathway of a fast-folding immunoglobulin domain revealed by single-molecule mechanical experiments. EMBO Rep. 2005;6(1):46–51. doi: 10.1038/sj.embor.7400317. [DOI] [PMC free article] [PubMed] [Google Scholar]
- 20.White SH, Jacobs RE. Statistical distribution of hydrophobic residues along the length of protein chains. Implications for protein folding and evolution. Biophys J. 1990;57(4):911–921. doi: 10.1016/S0006-3495(90)82611-4. [DOI] [PMC free article] [PubMed] [Google Scholar]
- 21.Wu Y, Kondrashkina E, Kayatekin C, Matthews CR, Bilsel O. Microsecond acquisition of heterogeneous structure in the folding of a TIM barrel protein. Proc Natl Acad Sci USA. 2008;105(36):13367–13372. doi: 10.1073/pnas.0802788105. [DOI] [PMC free article] [PubMed] [Google Scholar]
- 22.Oberhauser AF, Marszalek PE, Carrion-Vazquez M, Fernandez JM. Single protein misfolding events captured by atomic force microscopy. Nat Struct Biol. 1999;6(11):1025–1028. doi: 10.1038/14907. [DOI] [PubMed] [Google Scholar]
- 23.Peng Q, Fang J, Wang M, Li H. Kinetic partitioning mechanism governs the folding of the third FnIII domain of tenascin-C: Evidence at the single-molecule level. J Mol Biol. 2011;412(4):698–709. doi: 10.1016/j.jmb.2011.07.049. [DOI] [PubMed] [Google Scholar]
- 24.Xia F, Thirumalai D, Gräter F. Minimum energy compact structures in force-quench polyubiquitin folding are domain swapped. Proc Natl Acad Sci USA. 2011;108(17):6963–6968. doi: 10.1073/pnas.1018177108. [DOI] [PMC free article] [PubMed] [Google Scholar]
- 25.Bastolla U, Demetrius L. Stability constraints and protein evolution: The role of chain length, composition and disulfide bonds. Protein Eng Des Sel. 2005;18(9):405–415. doi: 10.1093/protein/gzi045. [DOI] [PubMed] [Google Scholar]
- 26.Richter K, Muschler P, Hainzl O, Buchner J. Coordinated ATP hydrolysis by the Hsp90 dimer. J Biol Chem. 2001;276(36):33689–33696. doi: 10.1074/jbc.M103832200. [DOI] [PubMed] [Google Scholar]
- 27.Onuchic JN, Luthey-Schulten Z, Wolynes PG. Theory of protein folding: The energy landscape perspective. Annu Rev Phys Chem. 1997;48:545–600. doi: 10.1146/annurev.physchem.48.1.545. [DOI] [PubMed] [Google Scholar]
- 28.Fedorov AN, Baldwin TO. Cotranslational protein folding. J Biol Chem. 1997;272(52):32715–32718. doi: 10.1074/jbc.272.52.32715. [DOI] [PubMed] [Google Scholar]
- 29.Shtilerman M, Lorimer GH, Englander SW. Chaperonin function: Folding by forced unfolding. Science. 1999;284(5415):822–825. doi: 10.1126/science.284.5415.822. [DOI] [PMC free article] [PubMed] [Google Scholar]
- 30.Mashaghi A, et al. Reshaping of the conformational search of a protein by the chaperone trigger factor. Nature. 2013;500(7460):98–101. doi: 10.1038/nature12293. [DOI] [PubMed] [Google Scholar]
- 31.von Hansen Y, Mehlich A, Pelz B, Rief M, Netz RR. Auto- and cross-power spectral analysis of dual trap optical tweezer experiments using Bayesian inference. Rev Sci Instrum. 2012;83(9):095116. doi: 10.1063/1.4753917. [DOI] [PubMed] [Google Scholar]
- 32.Mickler M, Hessling M, Ratzke C, Buchner J, Hugel T. The large conformational changes of Hsp90 are only weakly coupled to ATP hydrolysis. Nat Struct Mol Biol. 2009;16(3):281–286. doi: 10.1038/nsmb.1557. [DOI] [PubMed] [Google Scholar]
- 33.Bornschlögl T, Woehlke G, Rief M. Single molecule mechanics of the kinesin neck. Proc Natl Acad Sci USA. 2009;106(17):6992–6997. doi: 10.1073/pnas.0812620106. [DOI] [PMC free article] [PubMed] [Google Scholar]
- 34.Schlierf M, Berkemeier F, Rief M. Direct observation of active protein folding using lock-in force spectroscopy. Biophys J. 2007;93(11):3989–3998. doi: 10.1529/biophysj.107.114397. [DOI] [PMC free article] [PubMed] [Google Scholar]


