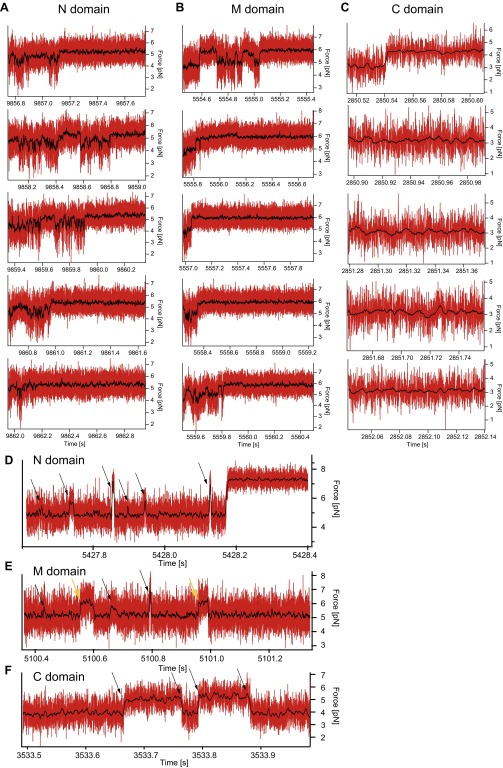
Fig. S5.
Example force signals during the waiting time of the individual domains. (A−C) Expanded sections of the force signal after the jump down while waiting at low forces (of Fig. S4) of the N domain (A), the M domain (B), and the C domain (C). (A) The population of multiple states with different contour length and timescales during the conformational search for the native state can be directly observed. If the native state (here around 5.4 pN) is reached, the N domain is stable at these forces. However, a stable state is not necessarily the native state, as we observe for the lowermost example trace that doesn’t show a native-like unfolding pattern in the probing ramp (see Fig. S4B). These example data also suggest that conversion between different misfolded states is possible, because different states are populated without visiting the completely unfolded states. (B) The M domain shows heterogenic behavior similar to that of the N domain. Here the native state is stable at around 6 pN. Like in A, the lowermost example trace is trapped in a more stable misfolded state but not in the native state (see Fig. S4C). (C) For the C domain, no additional states with significant contour length changes are observed. (D and E) Force signals of the N domain (D) and the M domain (E) at very high forces. At these forces mainly the completely unfolded state is populated. Arrows mark transitions into intermediate states that show a variety of contour lengths. Yellow arrows are most likely the M domain on-pathway intermediate. (F) Force signal of the C domain over 0.5 s. In contrast to the N and M domains, the C domain can refold and unfold completely (black arrows) at the timescale of the experiment. This is considered in the model describing the refolding behavior of the C domain (see Fig. 2L).

