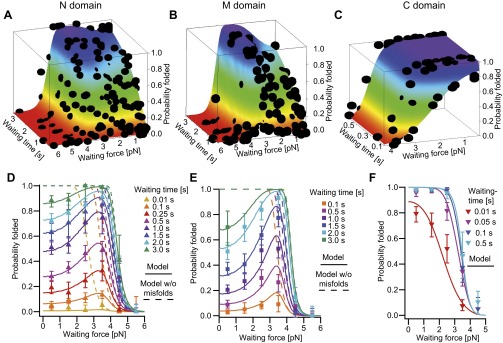
Fig. S6.
Force- and time-dependent refolding probabilities of the individual domains. (A–C) Measured, nonaveraged refolding probabilities (black dots) depending on waiting time and waiting force of the N domain (A), the M domain (B), and the C domain (C). These data sets are fitted with Eq. S10 for the N and M domain and Eq. S12 for the C domain as detailed in SI Methods. The fits are shown as colored surfaces within the graphs. (D–F) In Fig. 2 D–F, the averaged probabilities are plotted against the waiting time, and the waiting force is color coded. Here the refolding probabilities of the N domain (D), the M domain (E), and the C domain (F) are plotted against waiting force, and the waiting time is color coded. For the N and M domains, a considerable decrease in refolding probability at low forces is observed. Continuous lines are from the fits shown above. Dashed lines are the probabilities that would be expected if the misfolded state ensemble didn’t exist.

