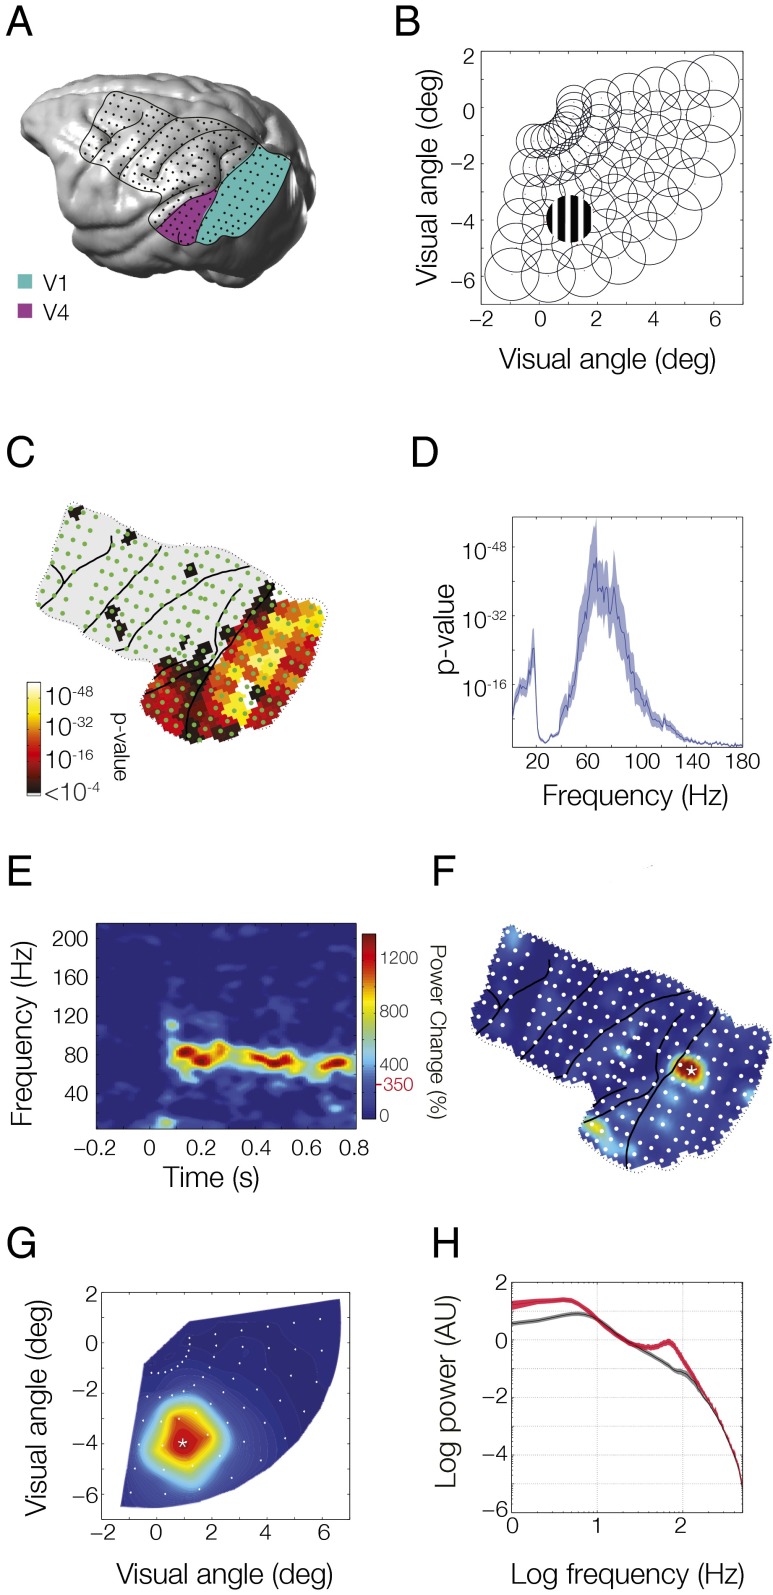
Fig. 1.
High-density ECoG layout and receptive field mapping paradigm. (A) Rendering of the brain of monkey P with the ECoG grid overlaid. Lines indicate the covered area with the major sulci. Dots indicate the 218 bipolar electrode derivations. Sites considered as lying in areas V1 and V2 are highlighted in green and those in areas V4 and TEO are highlighted in purple. (B) Receptive fields were mapped with scrolling gratings at 60 locations in the lower right quadrant, corresponding to the coverage of the ECoG array. (C) Selectivity of all ECoG sites for stimulus position based on stimulus induced power in all frequency bands. (D) Selectivity of position tuned sites as a function of frequency. (E–G) Example average response to stimulation at the position marked in B. (E) Time-frequency plot at the site marked by a star in F. Topographic plot of induced gamma power (80–95 Hz) for each ECoG site. (G) Induced gamma band response across all positions for the site marked in F. Color bar is the same for E–G; red line and value next to color bar indicate significance.

