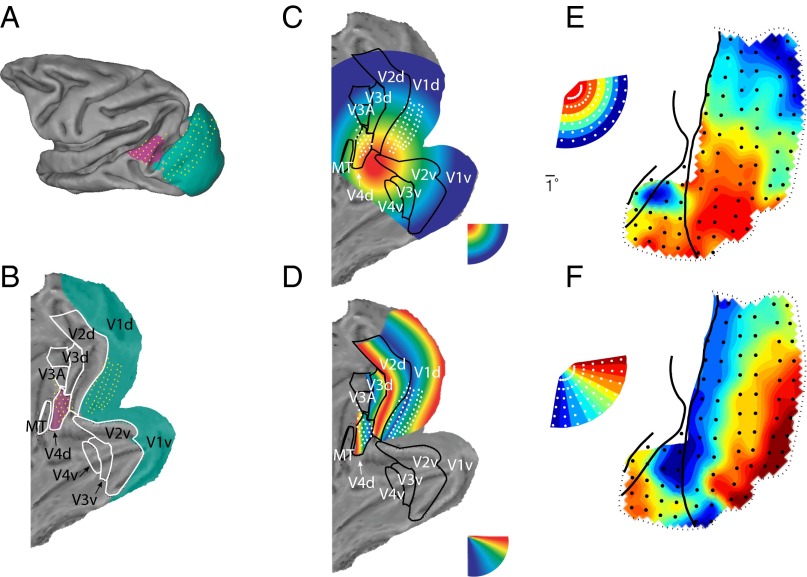
Fig. 2.
(A) Projection of ECoG electrodes on standard macaque brain [F99 macaque brain from Caret (75)]. (B) Same as A after unfolding. (C) Selectivity for visual stimulus eccentricity, as expected from previous retinotopic mapping studies using penetrating electrodes (25) or fMRI (26). (D) Same as C, for polar angle. (E and F) Retinotopic maps based on gamma band (80–95 Hz) activity in monkey P. (E) Map of eccentricity; each recording site is colored to indicate the mean eccentricity of the five stimuli giving the largest gamma band response. (F) Map of polar angle; each recording site is colored to indicate the mean polar angle as estimated above. Inset shows how the 60 stimulus locations are represented across eccentricity and polar angle.

