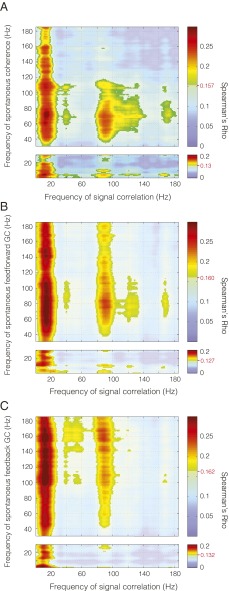
Fig. 6.
Spontaneous coherence and directed interaction. Correlation of (A) spontaneous coherence, (B) spontaneous feed-forward GC, and (C) spontaneous feedback GC with signal correlation for all frequencies. Frequency–frequency plane threshold set at P < 0.05 corrected for multiple comparisons. Significance threshold is denoted for each comparison by the red line and value on the color bar.

