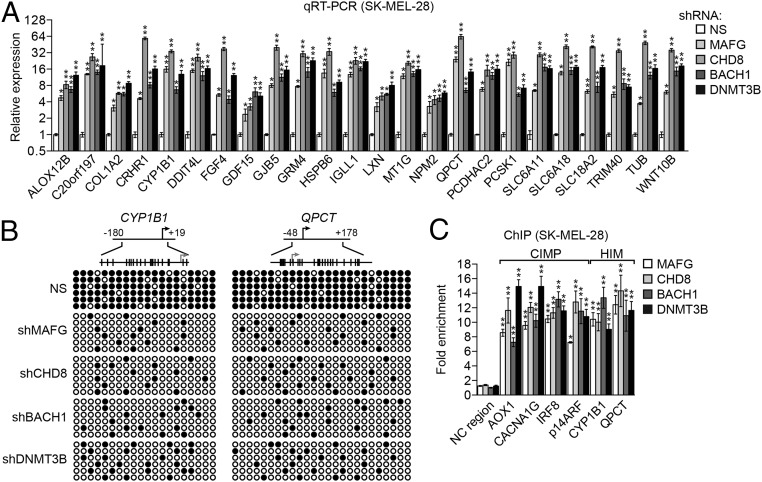
Fig. 2.
MAFG directs epigenetic silencing of genes frequently hypermethylated in melanoma. (A) qRT-PCR analysis monitoring expression of HIM genes in SK-MEL-28 cells expressing a MAFG, CHD8, BACH1, or DNMT3B shRNA. (B) Bisulfite sequencing analysis of representative HIM genes in SK-MEL-28 cells expressing a NS, MAFG, CHD8, BACH1, or DNMT3B shRNA. (Upper) Schematic of each promoter; positions of CpGs are shown to scale by vertical lines. (Lower) Each circle represents a methylated (●) or unmethylated (○) CpG dinucleotide. Each row represents a single clone. (C) ChIP analysis monitoring binding of MAFG, CHD8, BACH1, and DNMT3B on representative CIMP and HIM gene promoters or, as a negative control, an irrelevant DNA region (NC region) in SK-MEL-28 cells. Data are represented as mean ± SD. *P ≤ 0.05; **P ≤ 0.01.

