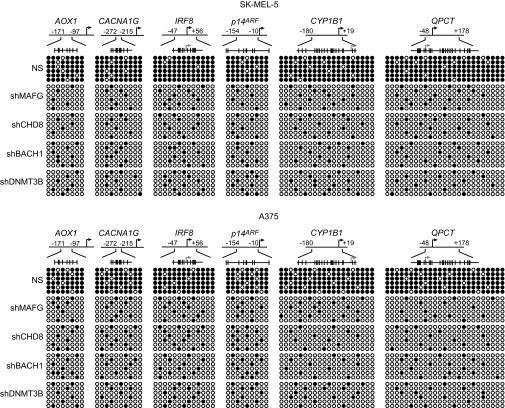
Fig. S5.
Bisulfite sequencing analysis of representative CIMP and HIM genes in additional human melanoma cell lines. Bisulfite sequencing analysis of representative CIMP and HIM genes in SK-MEL-5 (Upper) and A375 (Lower) cells expressing a NS, MAFG, CHD8, BACH1, or DNMT3B shRNA. (Upper) Schematic of each promoter; positions of CpGs are shown to scale by vertical lines. Each circle represents a methylated (●) or unmethylated (○) CpG dinucleotide. Each row represents a single clone.

