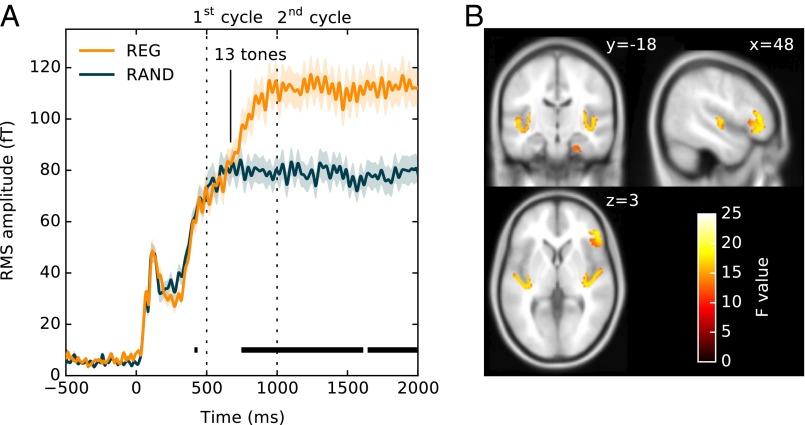
Fig. 4.
Buildup of regularity (experiment 2). (A) Responses to the onset of REG and RAND signals. The responses, including an M100 onset response, and a rise to a sustained response, are identical up to about 650 ms. Subsequently, activity in REG continues to build up until about 1,000 ms (two cycles) where it plateaus. Shading around the lines represents 2 SEM, computed with bootstrap resampling (60; 1,000 iterations; with replacement). Intervals where a repeated measures bootstrap procedure indicated significant differences between conditions are marked with a black line, underneath the brain response. (B) MEG source localization results. Shown is a group SPM t map for the REG > RAND contrast in the 650- to 950-ms interval, thresholded at P = 0.005 (uncorrected). These are superimposed on the MNI152 T1 template with the coronal and axial sections at x = 48, y = −18, and z = 3 mm, respectively.

