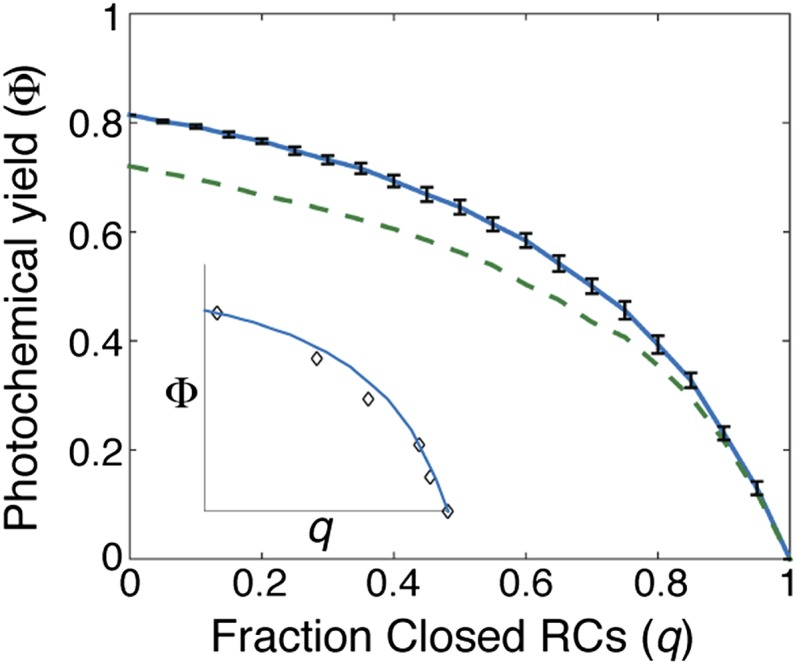
Fig. 4.

Simulation of the effect of closing reaction centers on photochemical yield. The solid blue line indicates the mixed membrane and the dashed green line the segregated membrane. Each calculated photochemical yield (Φ) along the membrane curve represents an average over different configurations of closed RCs. The standard deviation of each distribution along the mixed membrane is represented by black bars. (Inset) Comparison of the mixed membrane simulation with data (open black diamonds) from ref. 12, as reproduced in ref. 37.
