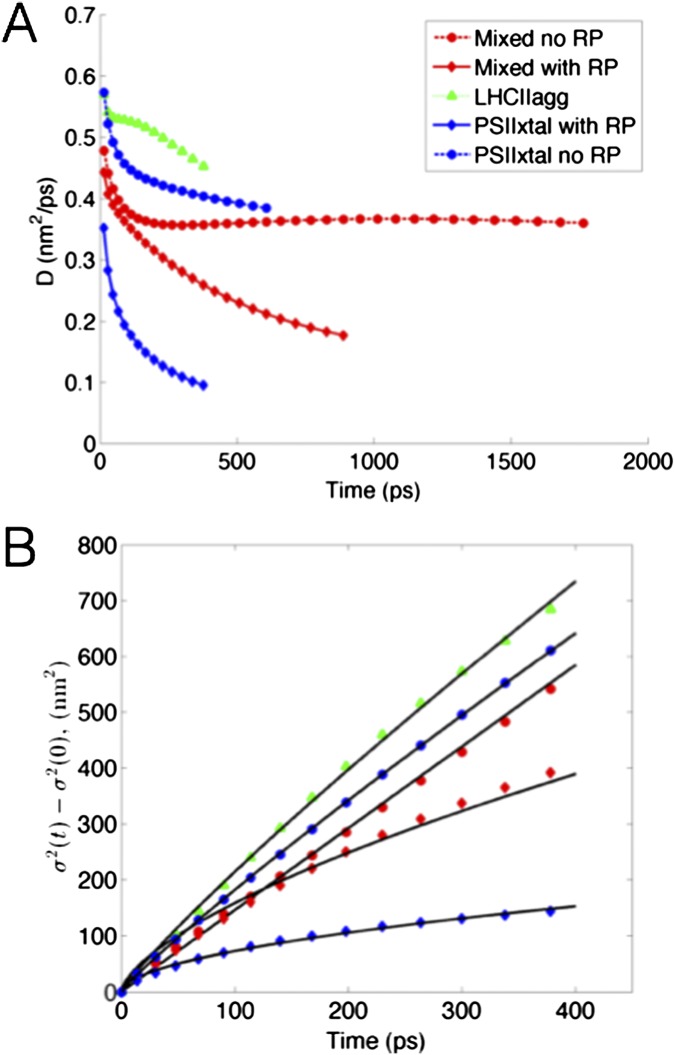
Fig. S3.
Additional plots of simulated diffusion of excitation. (A) Diffusivity D plotted against time for the five types of regions in the membrane (Eq. 1). (B) Plots of the fits of the equation , in which A and α were fit parameters, to diffusion dynamics in each of the five membrane regions.

