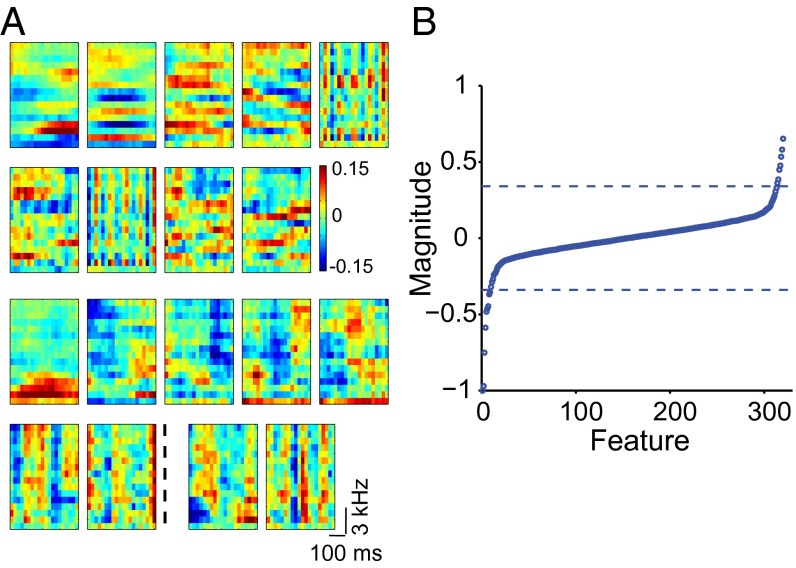
Fig. 5.
Composite receptive fields from larger datasets. (A) Examples of excitatory and suppressive features obtained from an NCM neuron using 60 1-minute-long songs. The top two rows show the nine significant excitatory features, and the two bottom rows show seven significant suppressive features. Two largest nonsignificant eigenvectors are also displayed (right-hand side of dotted line) and can be seen to contain structure and not only noise. (B) Eigenspectrum of the matrix J for the neuron in A. Eigenvalues were normalized for comparison with the data in Fig. 6B. The dashed lines indicate the two largest (in absolute value) positive and negative eigenvalues obtained from 500 symmetrical Gaussian random matrices with the same mean and variance as those of J.

