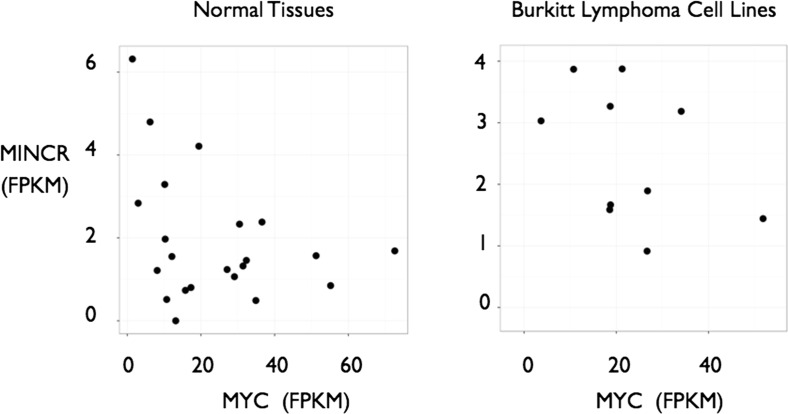
Fig. 1.
Expression levels of MINCR plotted against levels of MYC taken from normal tissues and cell lines (Left, data from ref. 2) and Burkitt lymphoma cell lines (Right, data from ref. 3) show a lack of significant positive correlation between MYC and MINCR. FPKM, fragments per kilobase of transcript per million mapped reads.

