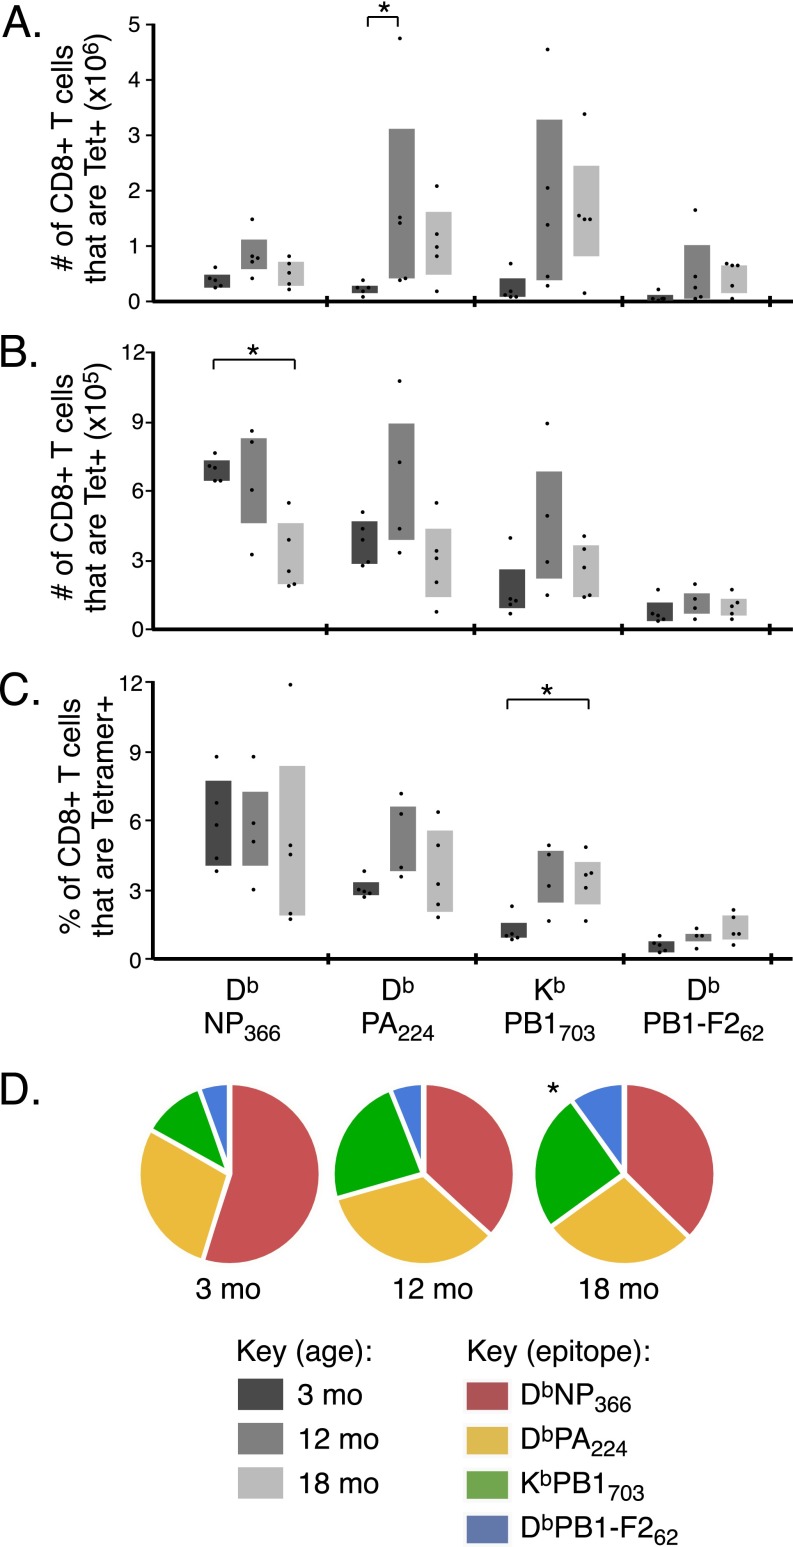
Fig. S1.
CD8 T-cell responses in lung and spleen. C57BL/6 mice were infected i.n. with IAV at 3, 12, and 18 mo. The absolute number of CD8+ T cells in the lung (A) and the absolute number (B) or the frequency (C) of CD8+ T cells in the spleen that are DbNP366-, DbPA224-, KbPB1703- or DbPB1-F262–specific, as assessed by tetramer staining at 10 d after infection. (D) The proportion of total tetramer+ CD8+ T cells specific for each of the 4 IAV epitopes in the spleen at 10 d after infection. Bar graphs represent interquartile range, *P ≤ 0.05 compared with 3-mo mice. Data represents two independent experiments (n = 4–5).

