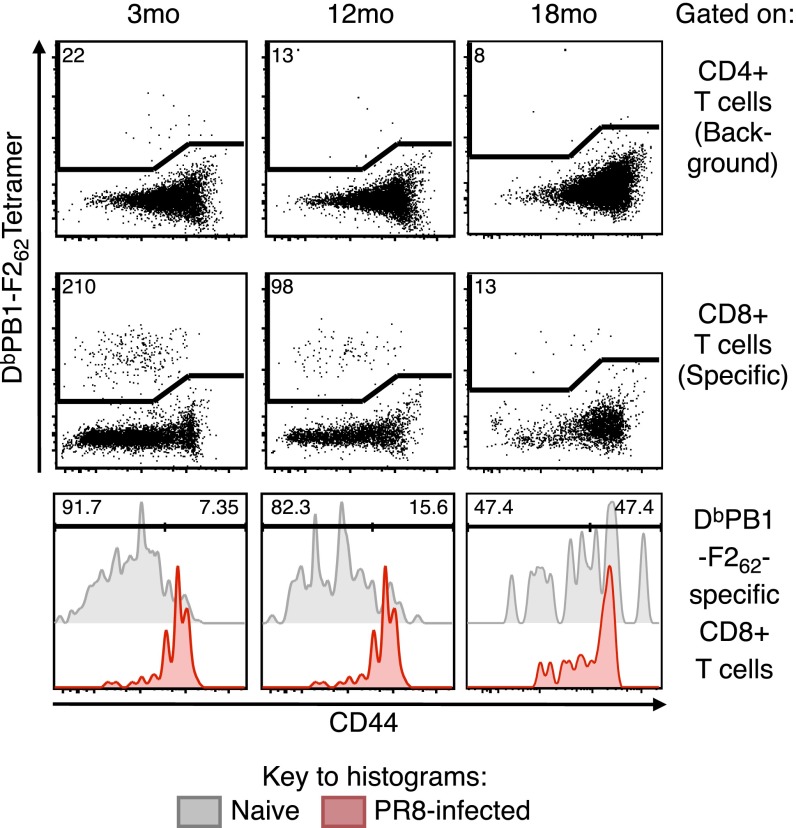
Fig. S4.
Representative dot plots of cells sorted for TCR clonotyping. For enumeration and sorting of DbPB1-F262–specific CD8 T cells in 3-, 12-, and 18-mo mice, cells were gated on singlets, live, lymphocytes, dump, and CD3+ events. From this gate, CD4+ events (Top) were used to define background at a median of 10 events, then CD8+ events (Middle) were assessed for DbPB1-F262–specific events. Numbers in the dot plots indicate the number of events sorted. Sorted cells were defined as CD44lo vs. CD44hi at the time of sorting by using DbPB1-F262–specific tetramer+ cells from IAV-infected mice (Bottom). Numbers in the histograms indicate proportion of DbPB1-F262–specific cells that are CD44lo or CD44hi.

