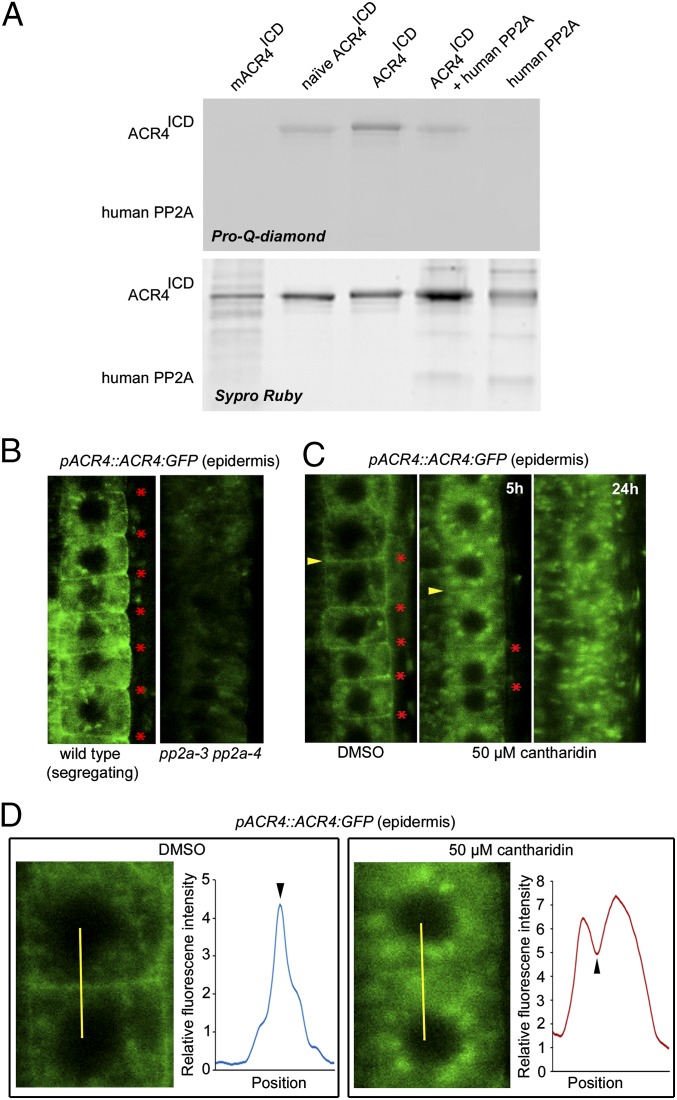
Fig. 4.
PP2A-3 dephosphorylates ACR4. (A) Pro-Q-diamond stained gel showing the phosphorylation status of ACR4ICD coincubated without or with PP2A-3 as indicated (Upper). The same gel stained with Sypro Ruby (Lower) as loading control. (B–D) Localization of ACR4:GFP in pp2a-3 pp2a-4 background (B) and following treatment with DMSO or 50 µM cantharidin for indicated hours (C and D). Red asterisk, plasma membrane with ACR4 localization; arrowhead, plasma membrane analyzed in D. (D) Detail of indicated membrane in C (yellow arrowhead) and quantification of GFP signal across the yellow line as smooth average graph. Black arrowhead, position of plasma membrane.

