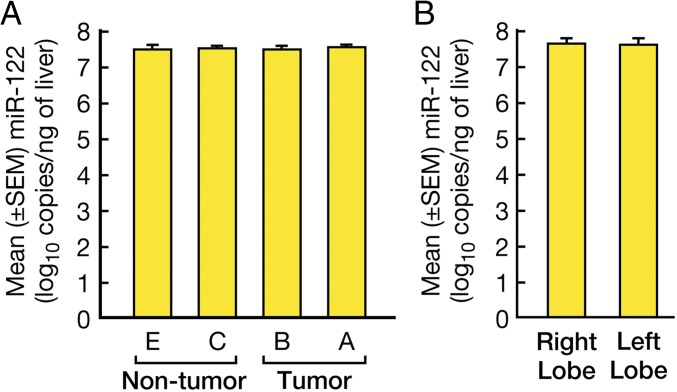
Fig. 2.
Intrahepatic expression of miR-122 in HCC-containing livers. (A) Bars represent the mean ± SEM miR-122 levels in the different areas of the livers as described in Fig. 1A. (B) Intrahepatic expression of miR-122 in control livers. Bars represent the mean ± SEM miR-122 levels in different areas of the livers as described in Fig. 1B.

