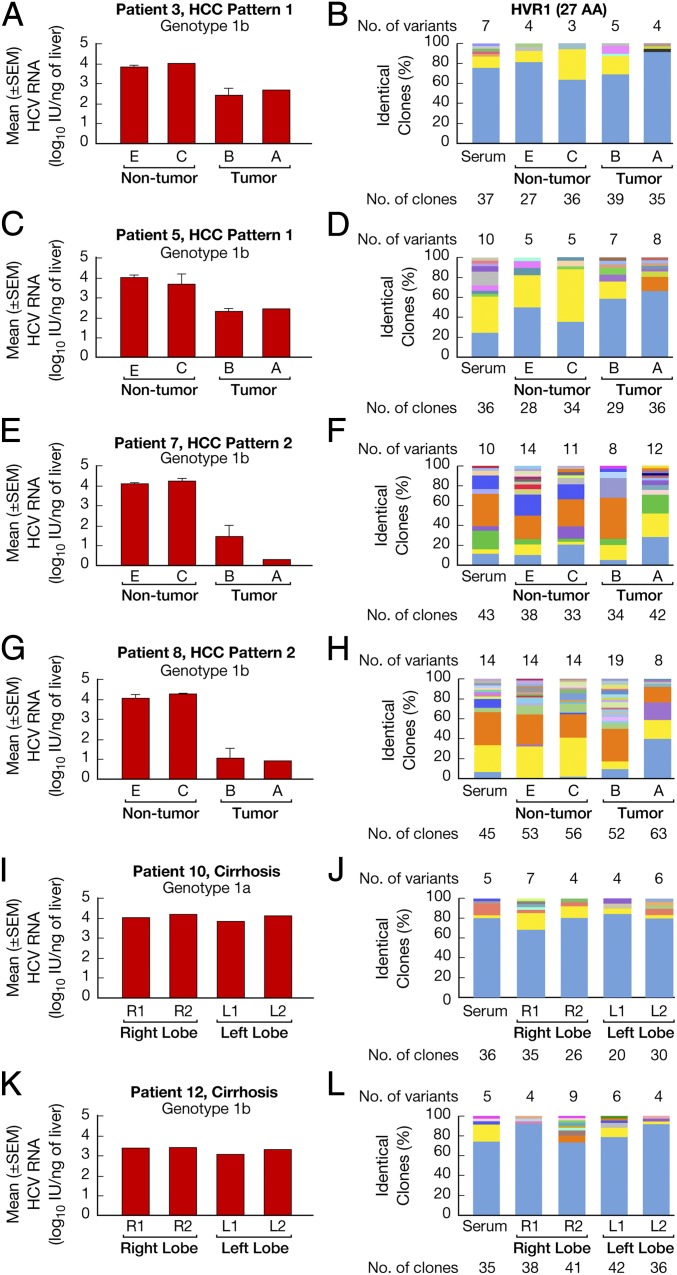
Fig. 3.
HCV quasispecies distribution in multiple liver areas of four representative patients with HCC and two representative controls with non-HCC cirrhosis. (A, C, E, G, I, and K) Bars represent the mean ± SEM HCV RNA levels in different areas of the liver from four representative HCC cases, two from pattern 1 (A and C), who exhibited a <2-log drop in HCV RNA within the tumor compared with the surrounding nontumorous areas, and two from pattern 2 (E and G), with a >2-log drop, as well as from two controls (I and K) with non-HCC cirrhosis. (B, D, F, H, J, and L) HCV quasispecies distribution in four representative HCC patients (two from pattern 1 and two from pattern 2) and in two controls with non-HCC cirrhosis. The vertical bars indicate the number and proportion of identical clones. The total number of variants identified in each liver compartment and serum is listed above the bars. The dominant viral variant found in each patient within the center of the tumor is shown in blue; other variants are shown in other colors. Within the vertical bars, each variant is identified by a different color. The same color indicates identity between viral variants detected in different liver compartments and serum within each patient but not between different patients. Patient numbers are the same as in Fig. 1 E and F.

