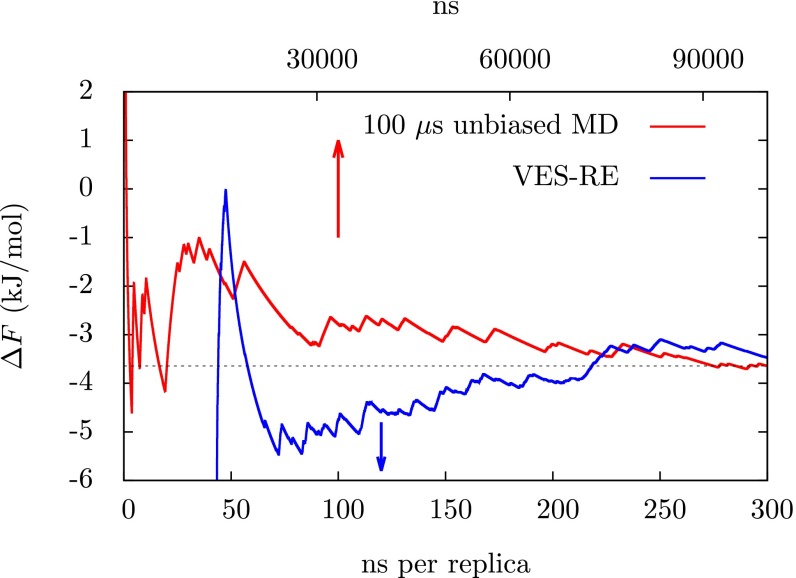
Fig. 2.
Estimates of the folding free energy as a function of simulation time from VES-RE and unbiased MD. The quantity is calculated according to Eq. S1 as described in the Supporting Information. The red line is from the 100-μs unbiased MD trajectory from ref. 1, the blue line is from VES-RE, and the horizontal black line is the converged value from the unbiased MD simulation for reference. The time scale for the unbiased MD simulation from ref. 1 is displayed on the top x axis and the time scale for VES-RE is displayed on the bottom x axis; arrows point to the appropriate axes. The first 50 ns of the VES-RE simulation was considered an equilibration period and was not used to estimate the folding free energy. To make an exact comparison of the computational resources used, one must consider that there were 12 replicas required for VES-RE.

