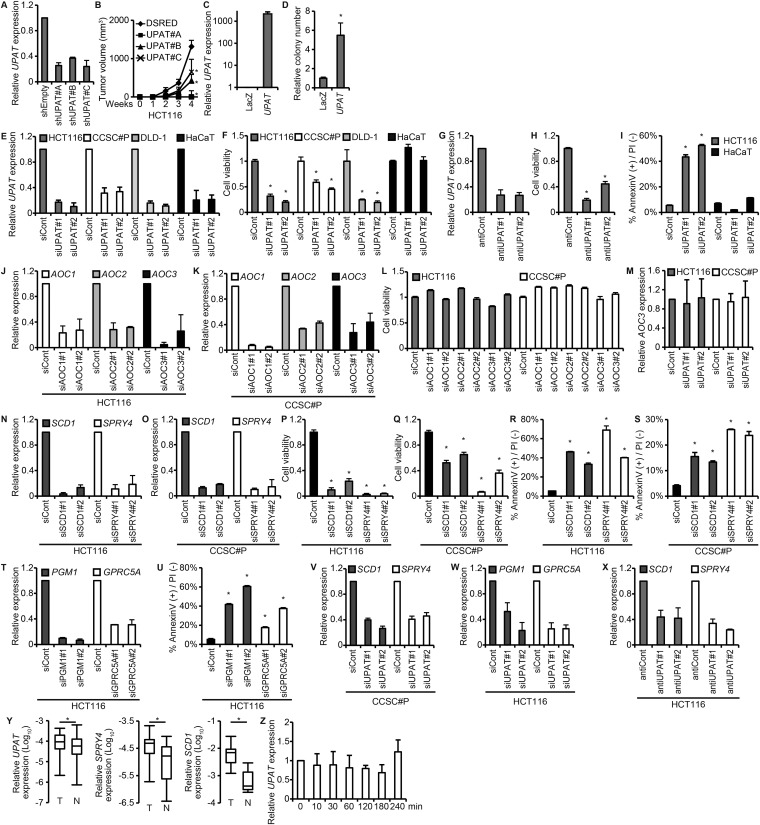
Fig. S2.
UPAT is required for the tumorigenicity and the expression of RAS-, CDH1-, and hypoxia-related genes in colon cancer cells. (A) qRT-PCR analysis of UPAT expression in HCT116 cells infected with a lentivirus harboring an shUPAT. Results are expressed as the mean ± SEM (n = 3). (B) HCT116 cells infected with a lentivirus expressing an shUPAT were injected into nude mice. Results are expressed as the mean ± SEM (n = 6). *P < 0.05. (C) qRT-PCR analysis of UPAT expression in CCSC#11 cells infected with a lentivirus expressing LacZ or UPAT. Results are expressed as the mean ± SEM (n = 3). (D) CCSC#11 cells were infected with a lentivirus expressing LacZ or UPAT and subjected to colony formation assays in soft agar. The number of colonies is shown as the relative number. Results are expressed as the mean ± SEM (n = 3). *P < 0.05. (E) qRT-PCR analysis of UPAT expression in HCT116, CCSC#P, DLD-1, and HaCaT cells transfected with siRNA targeting UPAT. Results are expressed as the mean ± SEM (n = 3). (F) Viability of HCT116, CCSC#P, DLD-1, and HaCaT cells transfected with siRNA targeting UPAT was assessed by Cell Titer-Glo assays. Results are expressed as the mean ± SEM (n = 3). *P < 0.05. (G) qRT-PCR analysis of UPAT expression in HCT116 cells transfected with an antisense oligonucleotide targeting UPAT (antiUPAT). Results are expressed as the mean ± SEM (n = 3). (H) Viability of HCT116 cells transfected with an antisense oligonucleotide targeting UPAT (antiUPAT) was assessed by Cell Titer-Glo assays. Results are expressed as the mean ± SEM (n = 3). *P < 0.05. (I) Annexin V assays were performed with HCT116 and HaCaT cells that had been transfected with siRNA targeting UPAT. Results are expressed as the mean ± SEM (n = 3). *P < 0.05. (J–L) The AOC family of genes, AOC1∼3, are not required for the survival of colon cancer cells. (J and K) qRT-PCR analysis of AOC1, AOC2, and AOC3 expression in HCT116 (J) and CCSC#P (K) cells transfected with siRNA targeting AOC1, AOC2, or AOC3. Results are expressed as the mean ± SEM (n = 3). (L) Viability of HCT116 and CCSC#P cells transfected with siRNAs targeting AOC1, AOC2, or AOC3 was assessed by Cell Titer-Glo assays. Results are expressed as the mean ± SEM (n = 3). (M) qRT-PCR analysis of AOC3 expression in HCT116 cells transfected with siRNA targeting UPAT. Results are expressed as the mean ± SEM (n = 3). (N and O) HCT116 (N) and CCDC#P (O) cells were transfected with siRNA targeting SCD1 or SPRY4 and subjected to qRT-PCR analysis. Results are expressed as the mean ± SEM (n = 3). (P and Q) Viability of HCT116 (P) and CCDC#P (Q) cells transfected with siRNA targeting SCD1 or SPRY4 was assessed by Cell Titer-Glo assays. Results are expressed as the mean ± SEM (n = 3). *P < 0.05. (R and S) Annexin V assays were performed with HCT116 (R) and CCSC#P (S) cells that had been transfected with siRNA targeting SCD1 or SPRY4. Results are expressed as the mean ± SEM (n = 3). *P < 0.05. (T) HCT116 cells were transfected with siRNA targeting PGM1 or GPRC5A and subjected to qRT-PCR analysis. Results are expressed as the mean ± SEM (n = 3). (U) Annexin V assays were performed with HCT116 cells that had been transfected with siRNA targeting PGM1 or GPRC5A. Results are expressed as the mean ± SEM (n = 3). *P < 0.05. (V) qRT-PCR analysis of SCD1 and SPRY4 expression in CCSC#P cells transfected with siRNA targeting UPAT. Results are expressed as the mean ± SEM (n = 3). (W) qRT-PCR analysis of PGM1 and GPRC5A expression in HCT116 cells transfected with siRNA targeting UPAT. Results are expressed as the mean ± SEM (n = 3). (X) qRT-PCR analysis of SCD1 and SPRY4 expression in HCT116 cells transfected with an antisense oligonucleotide targeting UPAT (antiUPAT). Results are expressed as the mean ± SEM (n = 3). (Y) qRT-PCR analysis of UPAT, SPRY4, and SCD1 expression in human colon cancer tissues (n = 17 pairs). *P < 0.05. (Z) qRT-PCR analysis of UPAT expression in HaCaT cells that had been cultured in the presence or absence of EGF for the indicated times. Results are expressed as the mean ± SEM (n = 3).

