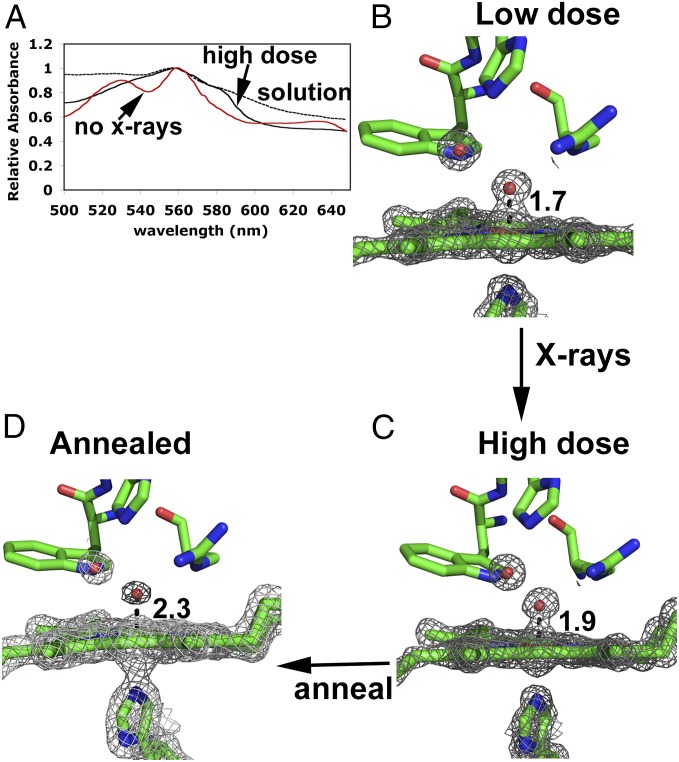
Fig. 3.
Spectra and structure of CmpI as a function of X-ray dose. (A) Single crystal spectra of CmpI before and after extensive (7.8 MGy) X-ray exposure and the solution spectrum of CCP reduced anaerobically with dithionite. 2Fo-Fc maps of the low-dose (B) and high-dose (C) CmpI structures taken from Meharenna et al. (6) are shown. (D) Structure (1.5 Å) of a high-dose crystal after annealing. All maps were contoured at 2.0 σ.

