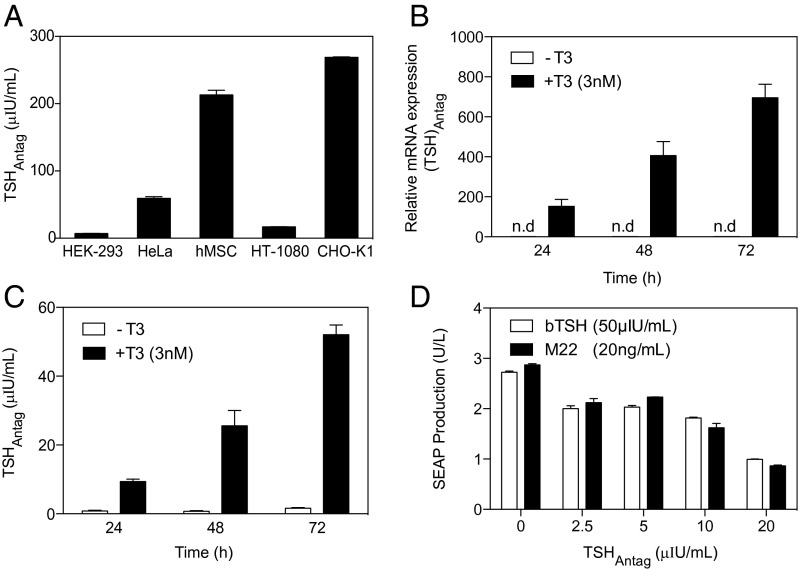
Fig. 3.
Characterization of TSHAntag in vitro. (A) TSHAntag secretion profiling from different mammalian cell lines transfected with constitutive TSHAntag expression vector pSP32 (PhCMV-TSHAntag-pA) and after 48 h using ELISA. (B) RT-PCR–based expression profiling of TSHAntag from TSR-TSHAntag–transgenic (pSP27/pSP34) CHO-K1 cells induced with 3 nM T3. (C) TSHAntag secretion profiling of TSR-TSHAntag–transgenic (pSP27/pSP34) CHO-K1 cells induced with 3 nM T3. (D) Stable TSHR-expressing CHO-K1 cells were transfected with pSP16 (PCREm-SEAP-pA), incubated with conditioned medium containing different amounts of TSHAntag, and challenged with 50 μIU/mL bTSH or 20 ng/mL M22 before SEAP levels were profiled in the culture supernatant. Data are the means ± SD of three independent experiments done in triplicate. n.d, not detectable.

