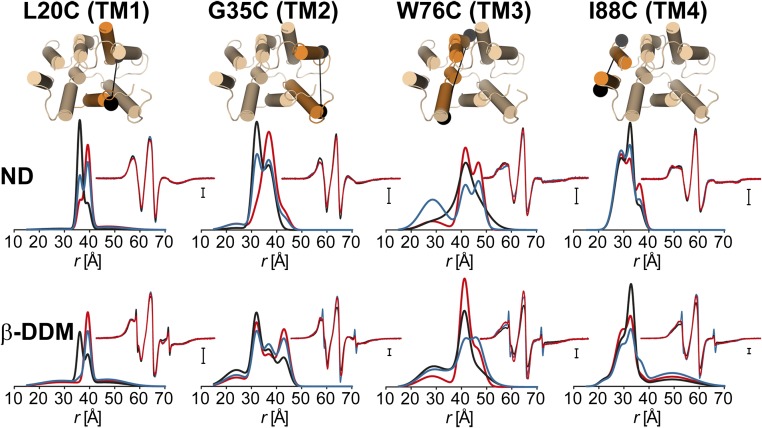
Fig. 4.
Ligand-dependent conformational changes of EmrE in nanodiscs (ND) composed of E. coli polar lipids. The distributions in DDM micelles are shown for reference: Apo (blue), proton-bound (black; pH 5 for β-DDM, pH 6 for nanodiscs), and TPP-bound (red). The CW-EPR spectra are shown in the Insets.

