Fig. S5.
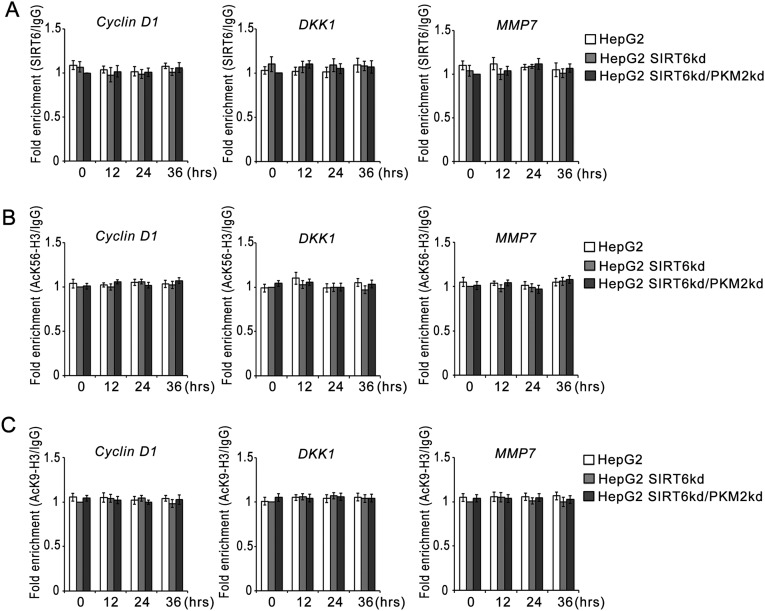
SIRT6 does not affect H3K9ac and H3K56ac levels at β-catenin target promoters. (A) HepG2 control (HepG2), SIRT6kd (HepG2 SIRT6kd), and SIRT6/PKM2 double-knockdown (HepG2 SIRT6kd/PKM2kd) cells were subjected to glucose starvation for the indicated periods. A ChIP assay then was performed with control IgG or SIRT6 antibody. The fold enrichment of coprecipitating DNA was determined by qPCR for the indicated promoters. Error bars represent means ± SD of three independent experiments with triplicate samples. (B) HepG2 control (HepG2), SIRT6kd (HepG2 SIRT6kd), and SIRT6/PKM2 double-knockdown (HepG2 SIRT6kd/PKM2kd) cells were subjected to glucose starvation for the indicated periods. A ChIP assay then was performed with control IgG or AcK56-H3 antibody. The fold enrichment of coprecipitating DNA was determined by qPCR for the indicated promoters. Error bars represent means ± SD of three independent experiments with triplicate samples. (C) HepG2 control (HepG2), SIRT6kd (HepG2 SIRT6kd), and SIRT6/PKM2 double-knockdown (HepG2 SIRT6kd/PKM2kd) cells were subjected to glucose starvation for the indicated periods. A ChIP assay then was performed with control IgG or AcK9-H3 antibody. The fold enrichment of coprecipitating DNA was determined by qPCR for the indicated promoters. Error bars represent means ± SD of three independent experiments with triplicate samples.

