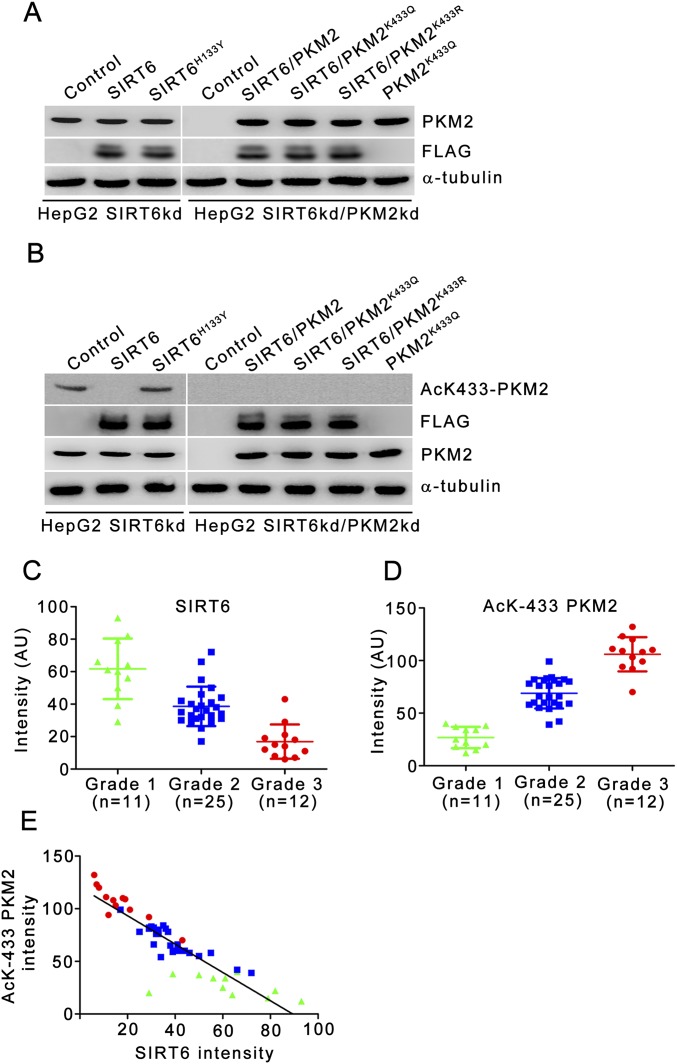
Fig. S6.
Expression levels of various SIRT6 and PKM2 constructs in stable cell lines and in xenograft tumors and quantitative analysis of SIRT6 and AcK433-PKM2 levels in human liver carcinoma. (A) HepG2 SIRT6kd or SIRT6/PKM2 double-knockdown cells (a pooled hygromycin-resistant population) were stably transfected with a dual expression plasmid encoding FLAG-tagged wild-type SIRT6, FLAG-tagged SIRT6H133Y, PKM2K433Q, FLAG-tagged wild-type SIRT6 along with wild-type PKM2 or PKM2K433Q or PKM2K433R as indicated. HepG2 SIRT6 knockdown or SIRT6/PKM2 double-knockdown cells stably transfected with empty vector served as control. The cells were harvested, and Western blotting was performed for the indicated proteins. (B) Tumor lysates (Fig. 7B) were prepared and analyzed by immunoblotting for the indicated proteins. The data shown are representative of three independent experiments. (C) Quantitation of SIRT6 levels in different grades of human liver carcinoma normalized with respect to matched normal adjacent tissue. The average signal intensity (in arbitrary units, AU) from four random fields was used for the analysis. The data shown are representative of three independent experiments. Error bars represent means ± SD. (D) Quantitation of AcK433-PKM2 levels in different grades of human liver carcinoma normalized with respect to matched normal adjacent tissue. The average signal intensity (in arbitrary units, AU) from four random fields was used for the analysis. The data shown are representative of three independent experiments. Error bars represent means ± SD. (E) Analysis of the correlation between SIRT6 (in C) and AcK433-PKM2 (in D) levels in human liver carcinoma (n = 48; Spearman's coefficient r = −0.8882, P < 0.0001).

