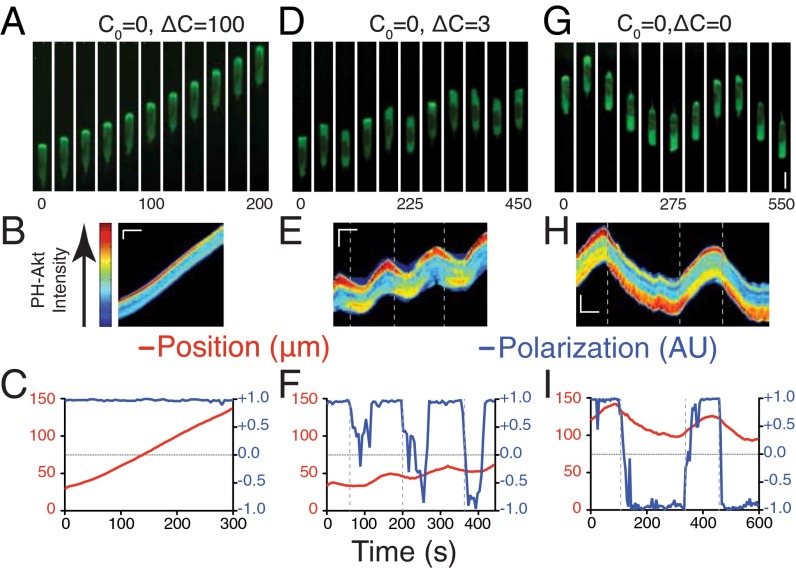
Fig. 1.
Cellular response to static chemical environments. (A) Montages of cells expressing PH-Akt-GFP in the conditions C0 = 0, ΔC = 100. (B) Kymograph of cell shown in A, false-colored according to the color bar shown on the left. (C) Plots of cell centroid and PH-Akt polarization (Experimental Procedures) for corresponding montage and kymograph. (D–F) Montage (D), kymograph (E), and plots (F) for a cell in the condition C0 = 0, ΔC = 3. (G–I) Montage (G), kymograph (H), and plots (I) for a cell in the condition C0 = 0, ΔC = 0 (C). (Vertical scale for montages: A, D, and G, 10 μm; vertical scale bar for kymographs: B, E, and H, 15 μm; horizontal scale bar for kymographs: B, E, and H, 100 s.) Vertical dashed lines were added to both kymographs and time plots to represent the time at which the cell was determined to have depolarized.

