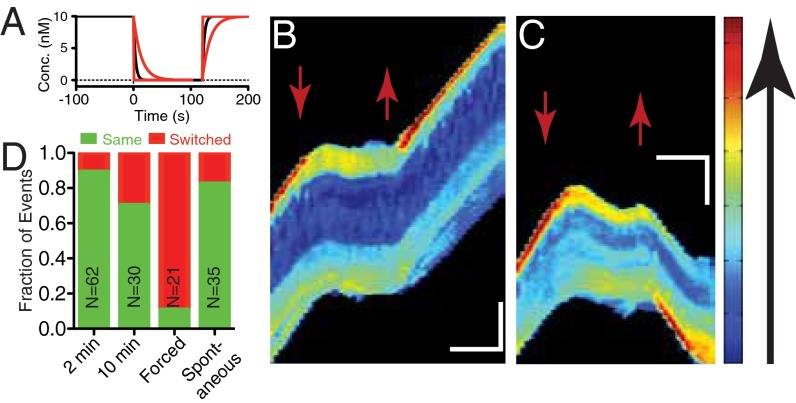
Fig. 3.
Directional bias persists after removal of chemokine. (A) Calculated plot of concentration as a function of time in the microchannel (wash at t = 0 s; reintroduction at t = 120 s). Solid lines represent the decay attributable to diffusion for a distance of 50 μm (black), 100 µm (red, slow decay), and 10 μm (red, fast decay) from the end of the channel. (B and C) Kymographs representing a cell repolarizing in the same direction (B) and in the opposite direction (C). Red arrows mark the time when chemokine was removed (down) and reintroduced (up). (Vertical scale bar: 15 μm; horizontal scale bar: 100 s). (D) Repolarization direction statistics for cells exposed to the dynamic environment. Chemokine removal for 2 or 10 min. Repolarization by introducing chemokine only at the previous back of the cell (“Forced”). Spontaneous polarizations in the absence of chemokine are also shown.

