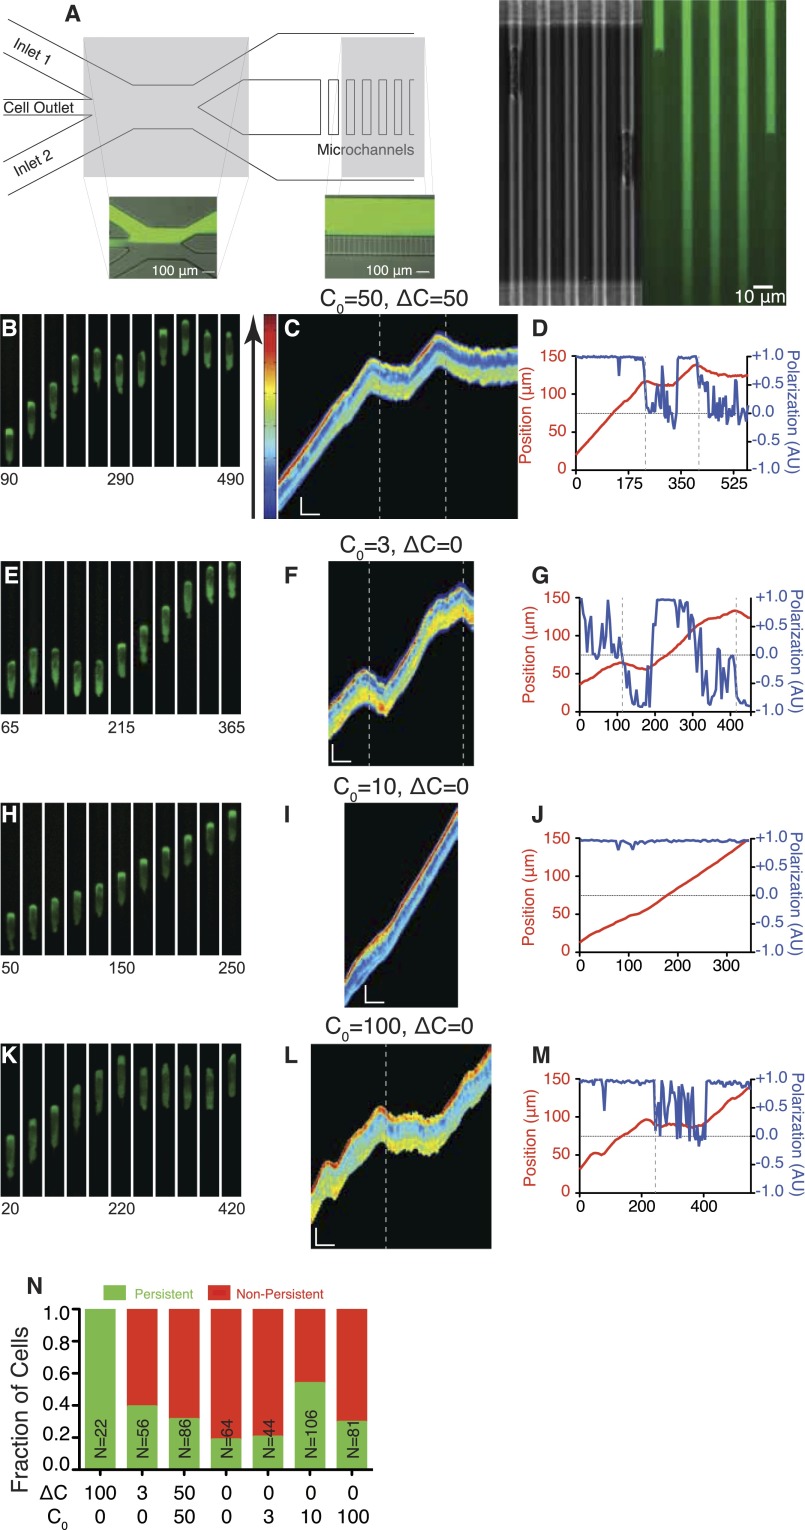
Fig. S1.
Device design and cellular response to static chemical environments. (A) Diagram of device geometry. Two inlet channels are used to introduce chemokine solutions into the device. The cell outlet channel is used when cells are introduced into the device from the outlet, downstream of the microchannel region. Insets demonstrate the positioning of the interface between the two inlet flows to balance pressure and maintain concentration difference across the microchannels. Fluorescein dye was used to visualize the separate streams. Inset shows a cell occluding a microchannel, resulting in build up of chemokine in front, as well as a microchannel without a cell resulting in a gradient of dye along the length of the channel. (B, E, H, and K) Montages of cells expressing PH-Akt-GFP in the conditions C0 = 50, ΔC = 50 (B); C0 = 3, ΔC = 0 (E); C0 = 10, ΔC = 0 (H); and C0 = 100, ΔC = 0 (K). (C, F, I, and L) Kymographs of cells shown in montages. Kymographs are false-colored according to the color bar shown on the left to better visualize differences in PH-Akt intensity. (Vertical scale bar: 15 μm; horizontal scale bar: 100 s.) (D, G, J, and M) Plots of cell centroid and PH-Akt polarization for corresponding montages. (N) Fraction of persistently polarized (green) and not persistently polarized (red) in the static conditions tested. Vertical dashed lines were added to both kymographs and time plots to represent the time at which the cell was determined to have de-polarized.

