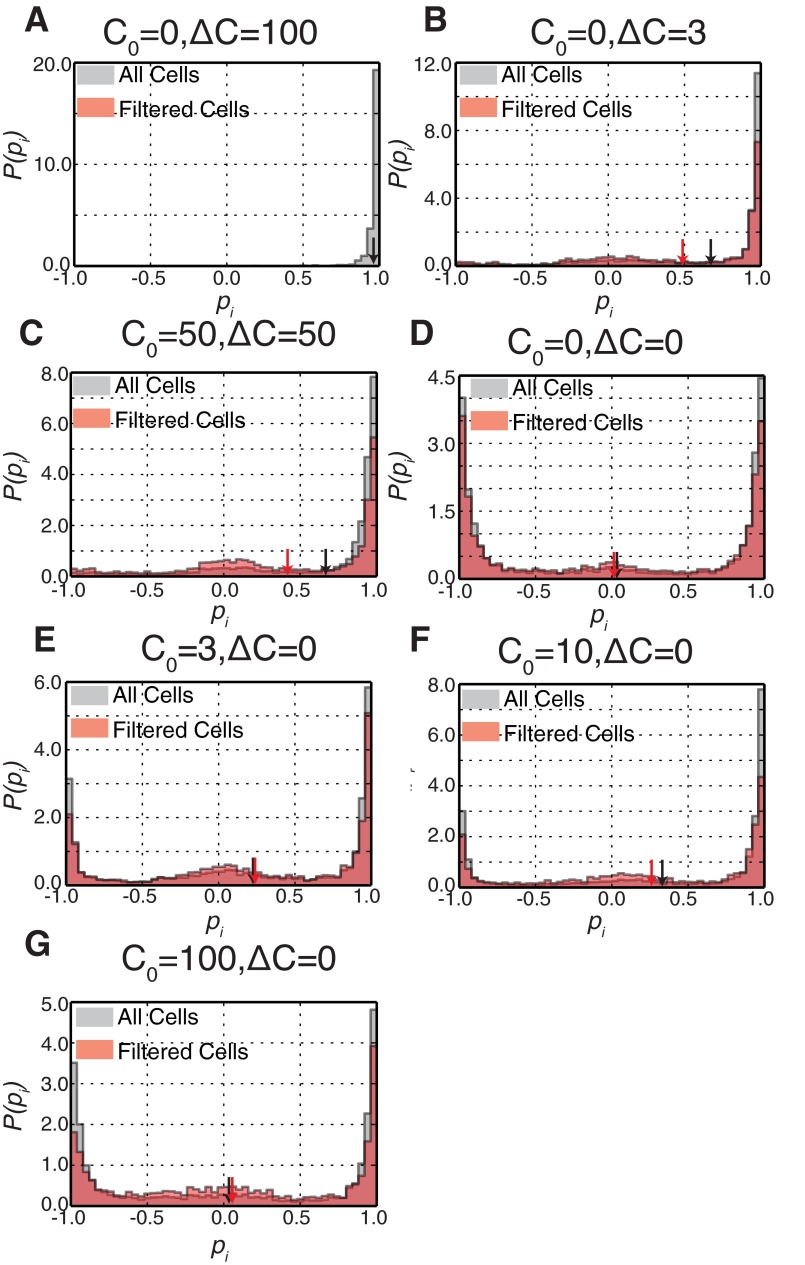
Fig. S2.
Histograms of instantaneous cell polarizations. Given that the vast majority of cells were polarized at the start of the observation period, we plotted the histogram of the entire trajectory (gray histogram) as well as the trajectory after the first depolarization event (red histogram) for all static conditions. Although there was a shift in the first-depolarization histogram, even small chemotactic differences resulted in a strong bias toward the original direction. (A–G) C0 = 0, ΔC = 100 (A); C0 = 0, ΔC = 3 (B); C0 = 50, ΔC = 50 (C); C0 = 0, ΔC = 0 (D); C0 = 3, ΔC = 0 (E); C0 = 10, ΔC = 0 (F); and C0 = 100, ΔC = 0 (G). Red and black arrows demonstrate the mean values for the two distributions in each condition.

