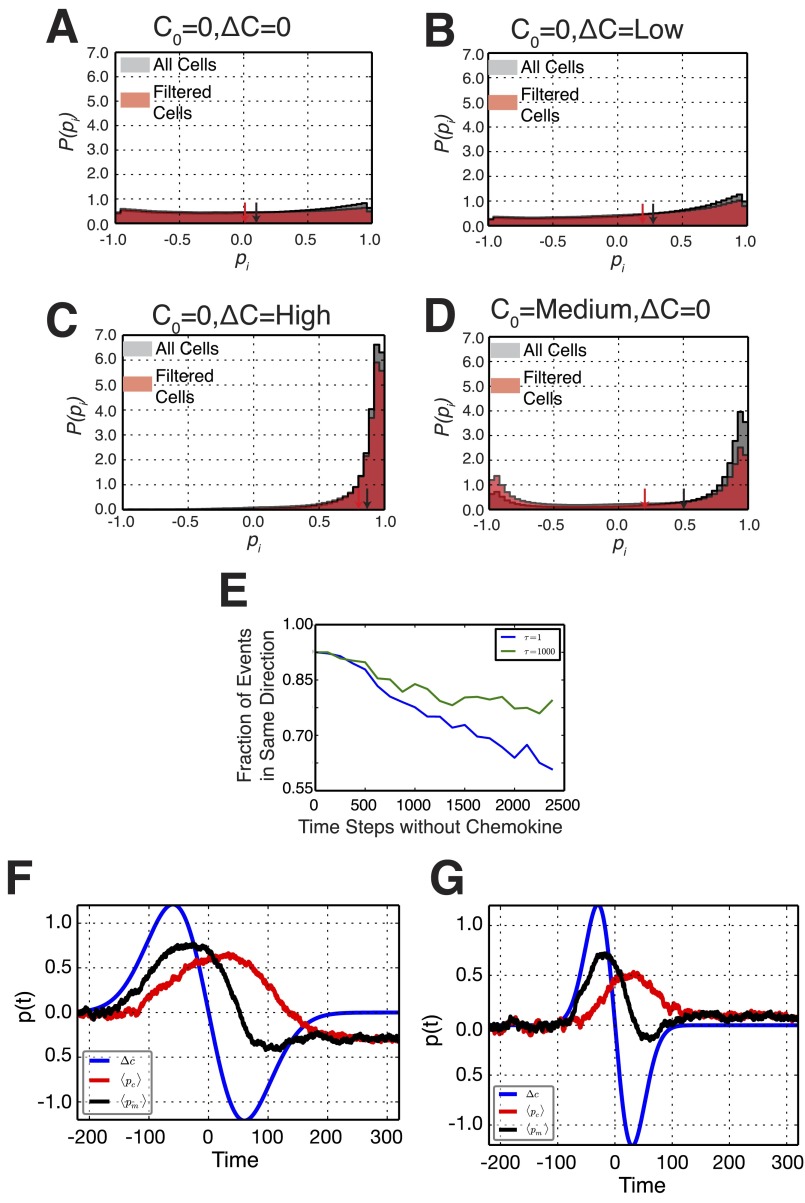
Fig. S4.
Histograms of simulated cell polarizations. Histograms of simulated cellular polarizations including all polarization measurements (gray) and only those that occurred following the first depolarization of a cell (red) for the conditions C0 = 0, ΔC = 0 (A); C0 = 0, ΔC = Low (B); C0 = 0, ΔC = High (C); and C0 = Medium, ΔC = 0 (D). (E) Directional repolarization statistics for simulated cells as a function of the amount of time between removal and reintroduction of chemokine for two parameters of the time scale of the memory kernel: smaller time scale with τ = 1 in blue and a larger time scale with τ = 1,000 in green. The larger time scale exhibits longer memory compared with the smaller time scale, with a higher fraction of cells repolarizing in the same direction at any time. (F) For slow waves, where the time scale of the positive gradient τΔn = 200 is larger than the time scale of the memory kernel τpc =100, the polarization of the membrane switches directions as seen by the final negative p(t) at long times. (G) For faster waves, where τΔn = 100 is comparable to τpc, the cell exhibits directional memory and does not switch polarization directions, as seen by the positive p(t) at long times. Details are found in Results.

