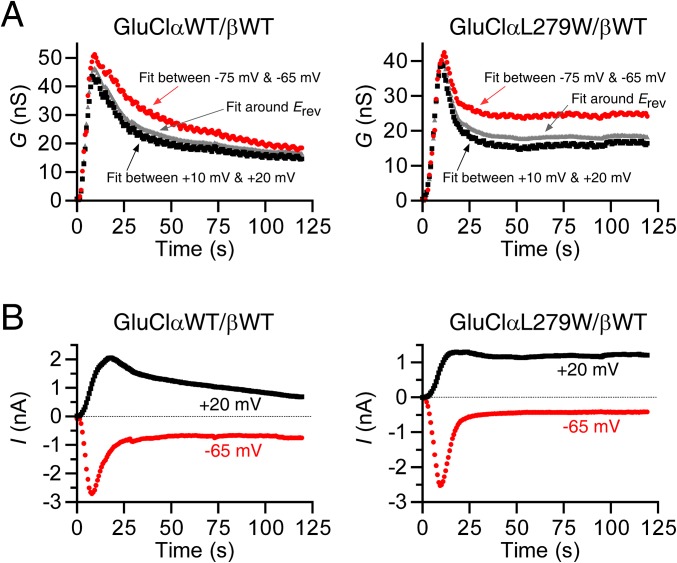
Fig. S6.
Conductance and current measured at different membrane voltages during application of saturating IVM concentrations. (A) Chloride conductance, G, measured during IVM application based on the slopes of the current–voltage (I/V) relations that were determined between −75 mV and −65 mV, around the reversal potential (Erev), and between +10 mV and +20 mV (SI Materials and Methods, Whole-Cell Patch-Clamp Recordings). Concentrations of 500 nM and 50 nM IVM were applied to the cells expressing the indicated WT and mutant receptors, respectively. (B) Current amplitudes extracted at the indicated membrane voltages from the voltage ramps’ output currents obtained during IVM application. Concentrations of 500 nM and 50 nM IVM were applied to the cells expressing the indicated WT and mutant receptors, respectively. Presented, for example, are the same cells whose conductance is shown in the rightmost panels of Fig. 5 C and D.

