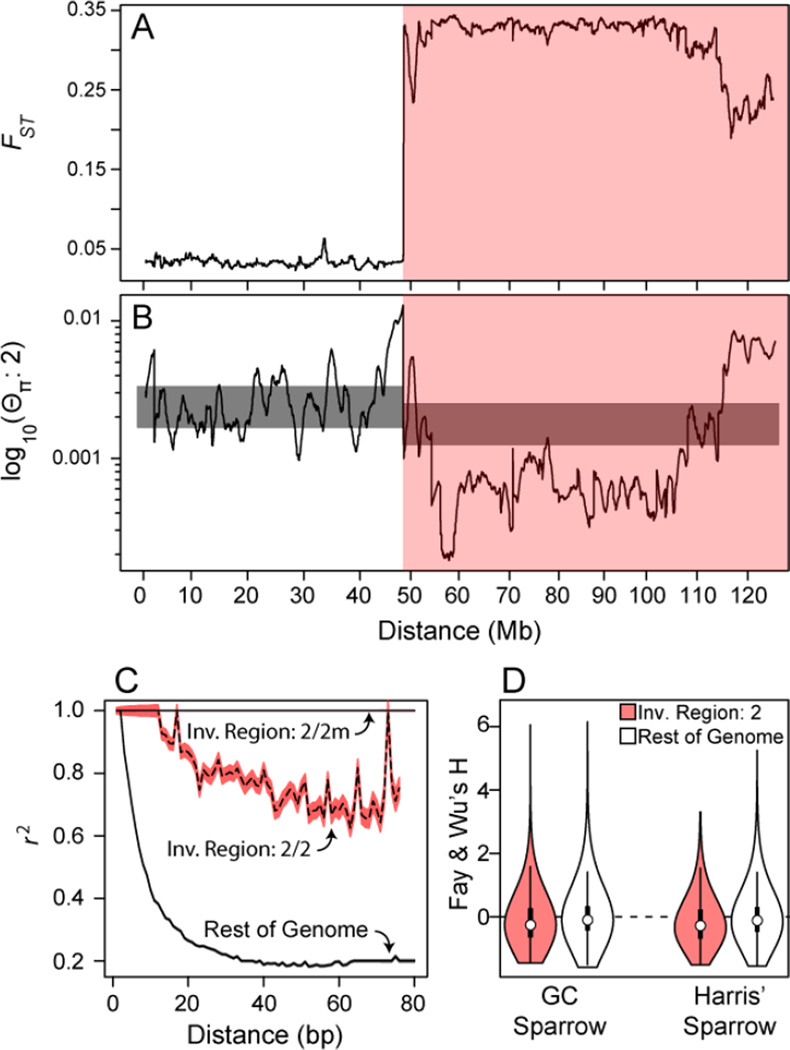
Figure 2. Contrasting divergence, diversity and linkage disequilibrium inside (pink area) and outside the inverted region.
Sliding window estimate across FISH-mapped scaffolds of (A) FST between white and tan birds and (B) genetic diversity along the tan allele, 2. The grey bar represents the 95% confidence band (standard deviation) of neutral expectation for genetic diversity . (C) Linkage disequilibrium decays rapidly outside of the inversion, but is high, especially in 2/2m heterozygotes, within the inversion. Using golden-crowned or Harris’ sparrow as outgroups, (D) Fay and Wu’s H estimates do not show a strong signal of recent selective sweeps in the inverted region of chromosome 2. See also Figures S1, S3 and Table S3.

