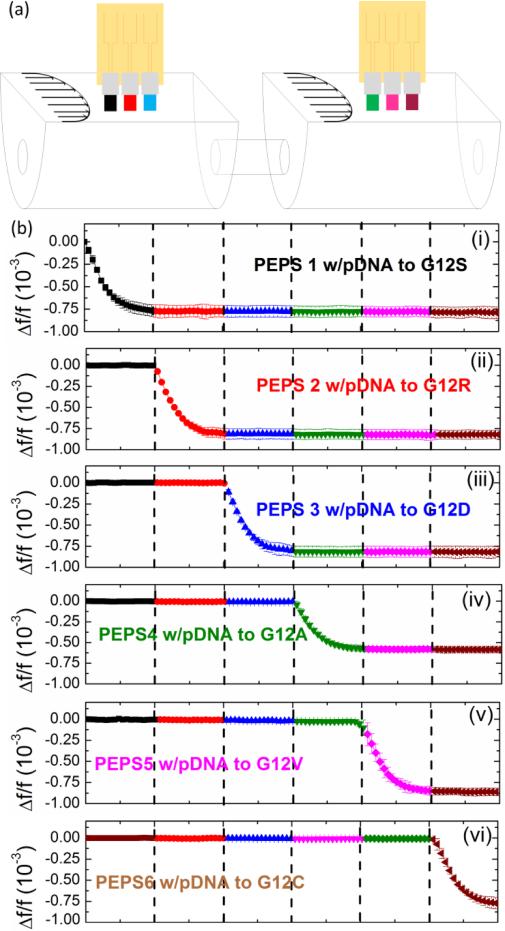
Figure 6.
(a) A schematic of a 6-PEPS array in two flow cells to detect 6 codon-12 KRAS mutations and (b) Relative frequency shift, PEPSs each coated with an LNA pDNA complementary to one of the 6 codon-12 KRAS mutations where 6 different urine samples each spiked with a different 12 KRAS mutation (coded with 6 different colors) were flown over the array PEPSs each for 30 min in succession.

