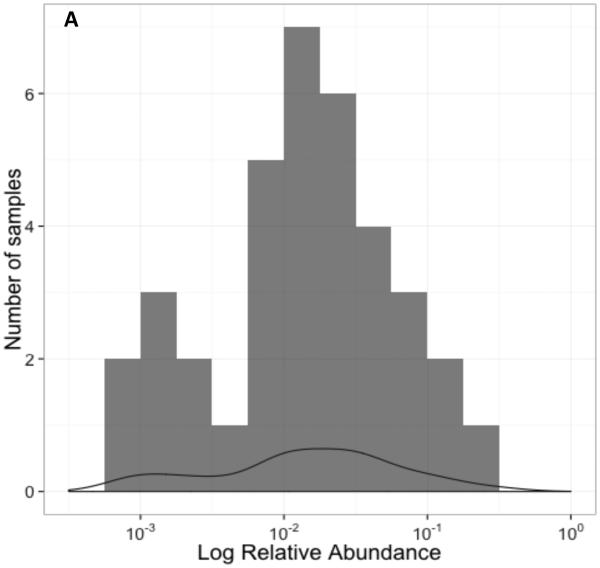
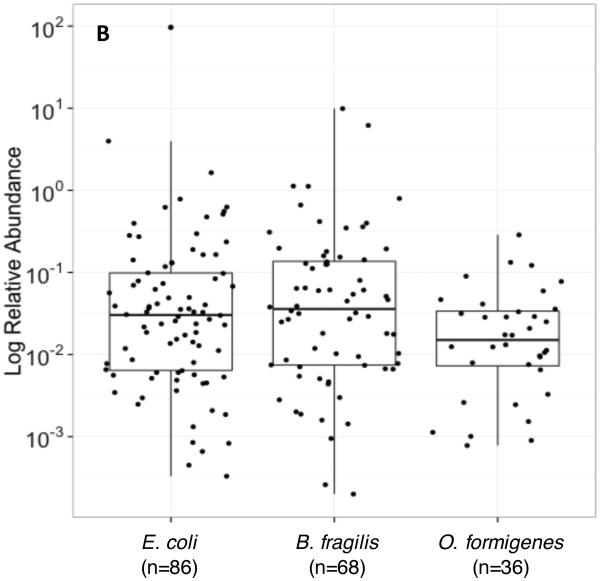
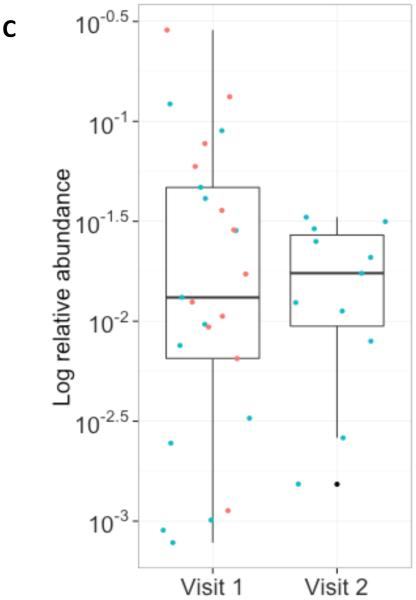
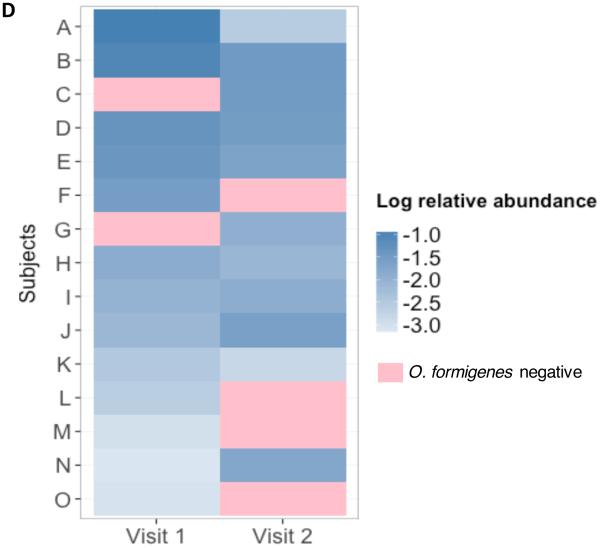
Figure 2. Relative abundance of O. formigenes in the 36 fecal samples in the MetaPhlAn WGS dataset.
Panel A: Histogram of number of samples by log relative abundance of O. formigenes. Panel B: Log relative abundance of O. formigenes (n=36) compared to E. coli (n=86) and B. fragilis (n=68). Box indicates median and inter-quartile range, and lines indicate 95% confidence interval. Panel C: Stability of O. formigenes log relative abundance in HMP subjects examined once, (red circles; n=51) or twice (blue circles; n=43), and found to be positive on at least one sample. Panel D: O. formigenes relative abundance by visit for the 15 subjects studied twice.


