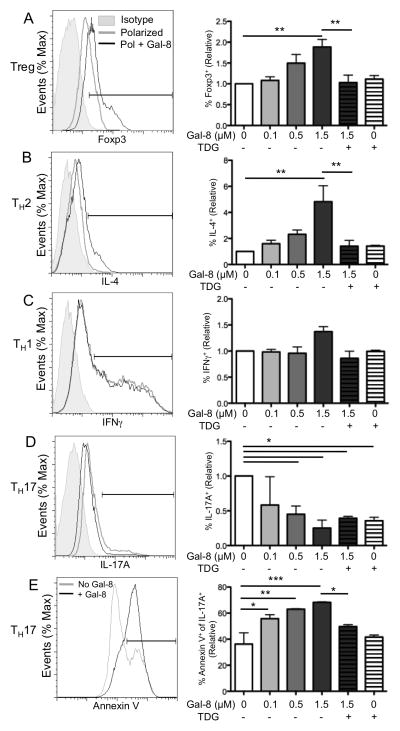
Figure 1. Galectin-8 promotes TH2 and Treg cell differentiation, and inhibits differentiation of TH17 cells.
Splenic CD4+ T cells were stimulated with plate-bound anti-CD3 and anti-CD28 mAb under Treg (A), TH2 (B), TH1 (C), or TH17 (D, E) polarizing conditions for 4 d in the presence of Gal-8 as indicated. Thiodigalactoside (TDG) was used as a galectin-specific inhibitor. (A–D) Intracellular expression of Foxp3, IL-4, IFNγ, and IL-17A was assessed by flow cytometry, with representative scatter plots gated on CD4+ cells shown. (E) TH17 cells were incubated with Gal-8 for 8 h, and death was measured as annexin V staining. Relative represents percentage of marker positive cells in gated population as compared to control. On overlayed histograms, % of max represents the total number of cells at a given fluorescence intensity compared to the maximum number of cells at any intensity for a given sample. Error bars represent mean ± SEM of at least three independent experiments. P values were determined by ANOVA with Tukey’s multiple comparison test. *, p < 0.05; **, p < 0.01; ***, p < 0.001.

