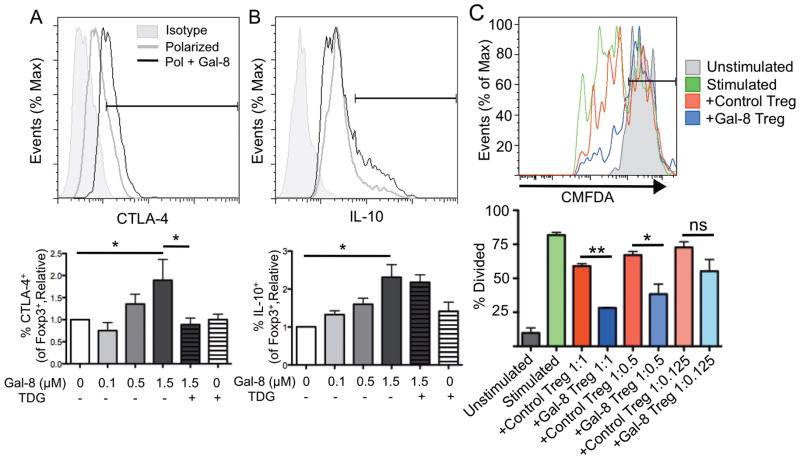
Figure 3. Galectin-8-polarized Treg cells express CTLA-4 and IL-10 at high frequency, and suppress T cell proliferation.
(A, B) Splenic CD4+ T cells were activated under Treg polarizing conditions for 96 h with or without Gal-8 as indicated. Expression of (A) CTLA-4 and (B) IL-10 gated on CD4+Foxp3+ cells was measured by flow cytometry. (C) CD4+ T cells from Foxp3mRFPIL-10eGFP mice were polarized to Treg for 4 d in the presence or absence of Gal-8 and Treg cells were sorted as CD4+RFP+ cells. Splenic CD4+ T cells were isolated from B6 mice and stained with CMFDA, and the rest of the spleen was irradiated to use as a source of APCs. Proliferation of unstimulated CD4+CMFDA+ cells, or cells stimulated for 3 d in the presence or absence of control or Gal-8-polarized Treg cells was assessed as dilution of CMFDA. Ratios are activated T cells: Treg cells. Relative represents percentage of marker positive cells in gated population as compared to control, and % of max represents the total number of cells at a given fluorescence intensity compared to the maximum number of cells at any intensity for a given sample. Error bars represent mean ± SEM of at least three independent experiments. P values were determined by ANOVA with Tukey’s multiple comparison test. *, p < 0.05; **, p < 0.001; ns, not significant.

