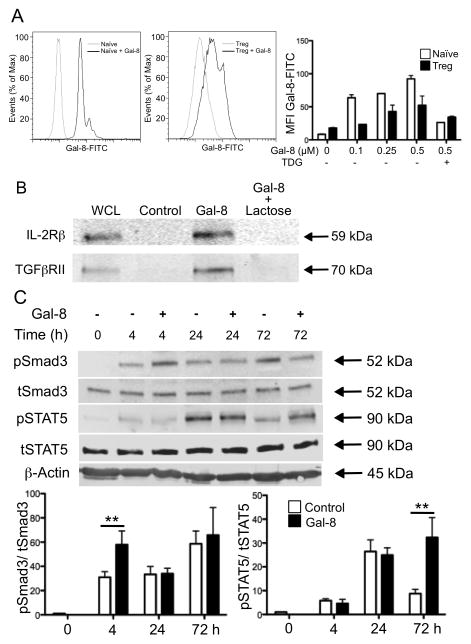
Figure 4. Galectin-8 activates TGFβR and IL-2R signaling pathways.
(A) Gal-8 binding to the surface of naïve T cells and Treg cells was assessed by incubation with Gal-8-FITC. % of max represents the total number of cells at a given fluorescence intensity compared to the maximum number of cells at any intensity for a given sample. Mean fluorescence intensity (MFI) is averaged across two independent experiments, and error bars are mean ± SEM. (B) Splenic CD4+ T cells were activated with anti-CD3 and anti-CD28 mAbs, lysed, and incubated with agarose beads alone (Control), or Gal-8-conjugated beads in the presence or absence of the competitive inhibitor lactose. Bound fractions and whole cell lysate were analyzed by western blotting for Gal-8-binding proteins. Blots are representative of three independent experiments with similar results. (C) CD4+ T cells were polarized toward a Treg cell profile in the presence or absence of Gal-8, lysates were collected at indicated times, probed for pSTAT5 and pSmad3, and each normalized to the appropriate non-phosphorylated control. Error bars represent mean ± SEM of at least three independent experiments. P values were determined by ANOVA with Tukey’s multiple comparison test. **, p < 0.01.

