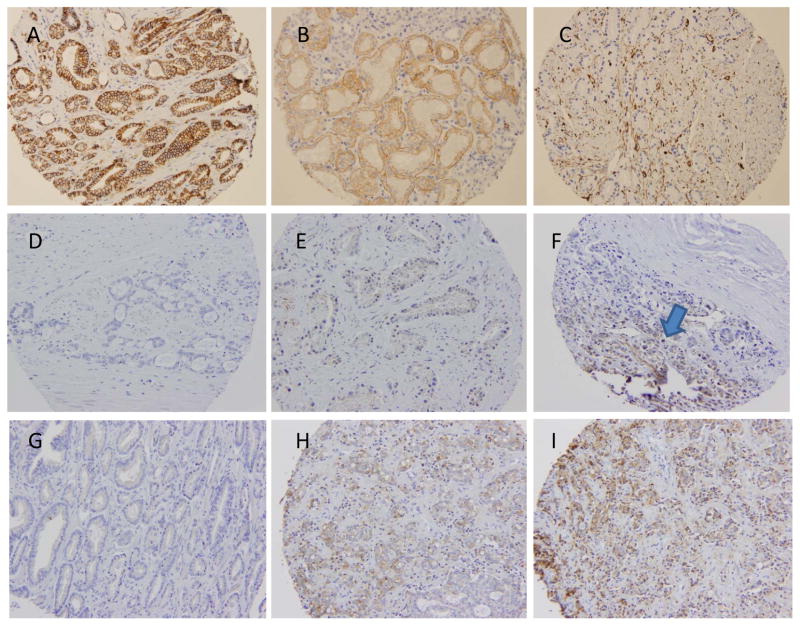
Figure 2.
Representative prostate cancer tissue microarray (TMA) immunohistochemical (IHC) staining examples from the Durham VA SEARCH database, stained for A) E-cadherin (2+), B) N-cadherin (1+), and C) vimentin (2+). D-F shows ZEB1 expression (0, 1, and focal 2 (arrow), respectively). G-I shows SNAIL expression (0, 1, 2, respectively). Images of TWIST expression are available in supplementary figure 1.

