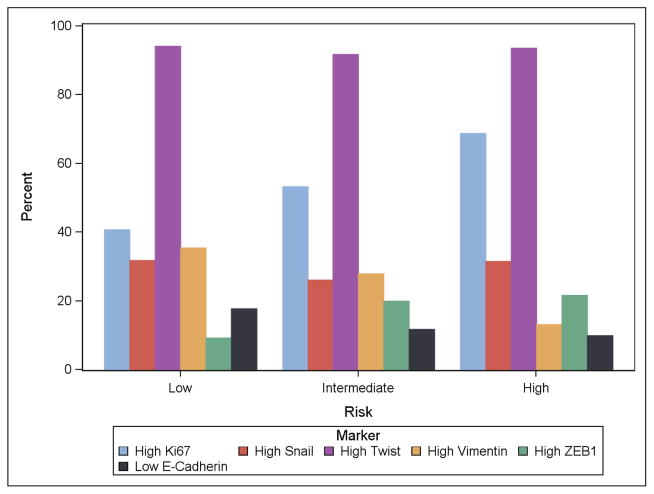
Figure 3. Bar graph demonstrating the association of epithelial plasticity biomarkers with NCCN risk group.
Low risk includes PSA<10, Gleason 6 or less, and pT2a or less pathologic stage. Intermediate risk includes PSA 10–20, Gleason 7, or pT2b. High risk includes PSA>20, Gleason 8–10, or stage T2c or higher. Biomarkers are classified by the proportion high: average Ki67 above median, maximum SNAIL 2–3+, maximum TWIST 2–3+, maximum vimentin 1–2+, maximum ZEB1 2–3+. For E-cadherin, classification is by the proportion low (0–1+) using the minimum value per subject across the TMA.

