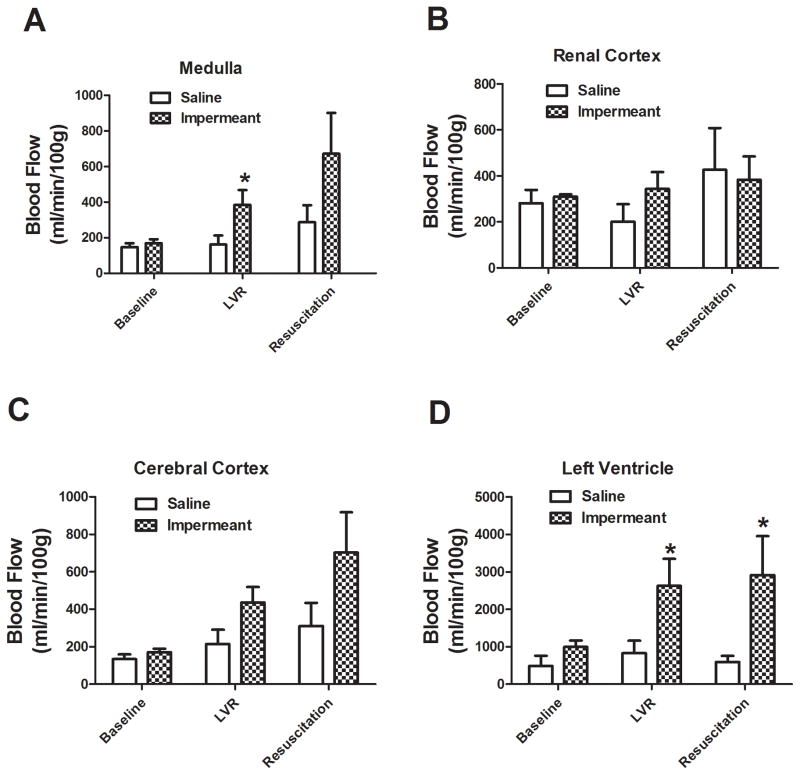
Figure 6.
Capillary blood flow in medulla, cerebral cortex, renal cortex, and left ventricle at baseline, after the LVR period, and after the full resuscitation period in 6 rats per group. The two groups compared were saline LVR solution (Saline) and a saline LVR solution with an impermeant mixture. * P< 0.05 relative to the corresponding value for saline. Capillary blood flow was measured using the colored microsphere technique.

