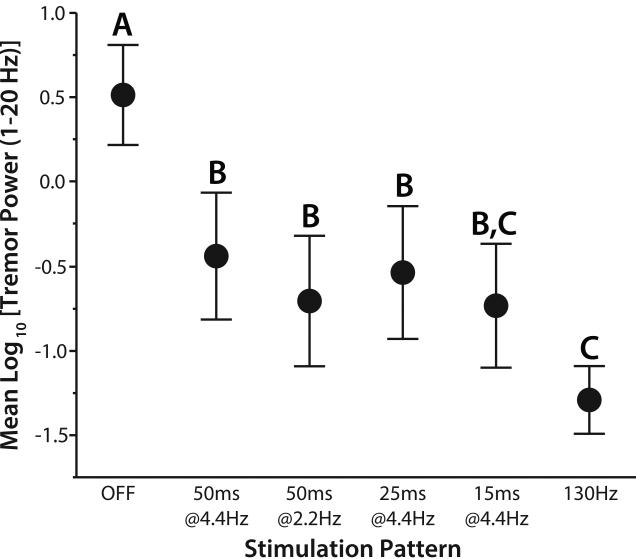
Figure 4.
Effects of DBS with temporal patterns of stimulation containing short pauses on postural tremor. Mean ± standard error is plotted as a function of stimulation pattern. Log-transformed tremor power (LTP) varied across stimulation patterns (F = 18.8, p<0.0001, linear mixed-effects model). Levels not sharing the same letter are significantly different (p<0.05, Tukey’s HSD).

