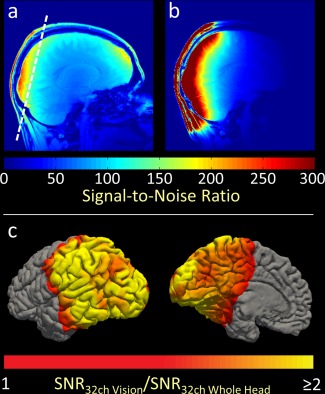
Figure 3.

Volume‐ and surface‐based visualization of in vivo SNR comparison of the visual cortex coil compared with a vendor‐supplied 32‐channel whole‐head coil. (a) SNR map of the whole head. The dashed line indicates the slice position for the g‐factor maps (see Fig. 4). (b) SNR map of the visual cortex coil. (c) SNR gain of the visual cortex coil as a ratio of the whole head coil SNR. The optimizations employed in the visual cortex coil resulted in a two‐fold SNR improvement near the coils, and approximately 50% improvement elsewhere in the visual cortex.
