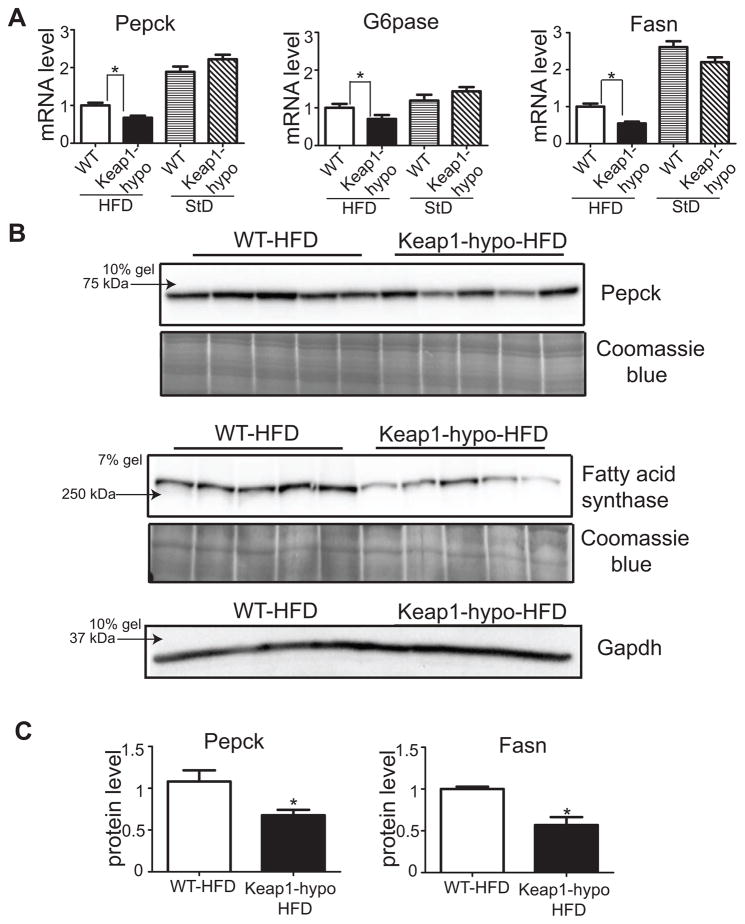
Figure 2. Keap1-hypo mice show repressed hepatic expression of gluconeogenic and lipogenic enzymes.
A. mRNA levels of Pepck, G6pase and Fasn as assessed by qRT-PCR. Data show mean ± SEM. n = 9–10 per genotype. *P<0.05.
B. Pepck and Fasn expression as assessed by immunoblotting. Coomassie blue staining and Gapdh expression is shown for loading control purposes.
C. Relative quantification of Pepck and Fasn protein levels. Coomassie blue staining intensity was used as loading control. Data show mean ± SEM. n = 5 per genotype. *P<0.05

