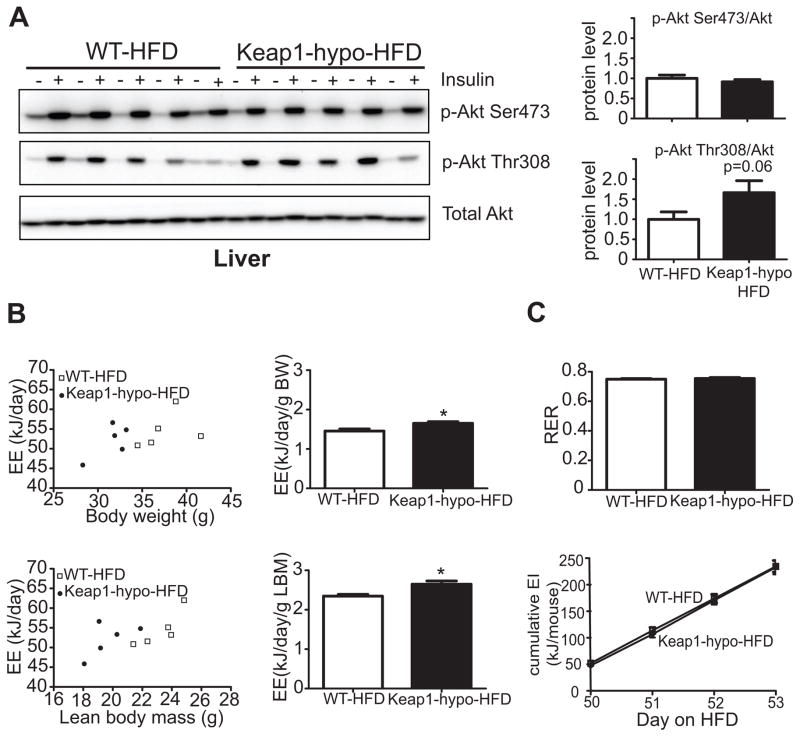
Figure 5. In vivo liver insulin signaling and indirect calorimetry in Keap1-hypo mice.
A. Insulin signaling study. Mice that have been on high-fat diet for 90 days were fasted for 16h overnight and then injected intraportally with 10 units/kg insulin. Liver biopsies were obtained before and five minutes after the insulin injection. Immunoblots show phosphorylation of Akt at Ser473, Thr308 and total Akt in the livers of WT and Keap1-hypo mice before (−) and after (+) intraportal insulin administration. The diagrams show relative protein amount of p-Akt Ser473 and p-Akt Thr308 after normalization to total Akt levels. n = 5 per genotype. *P<0.05 compared to WT-HFD.
B. Raw energy expenditure (EE) values plotted against body weights (BW) or lean body mass (LBM) (as calculated by Echo-MRI) for both WT and Keap1-hypo mice after 50 days on HFD. The diagrams show body weight-normalized and lean body mass-normalized energy expenditure. Data show mean ± SEM. N=5 per genotype. *P<0.05 (WT-HFD vs. Keap1-hypo-HFD).
C. Respiratory exchange ratio (RER) and energy intake (EI) of WT and Keap1-hypo mice after 50 days on HFD.

