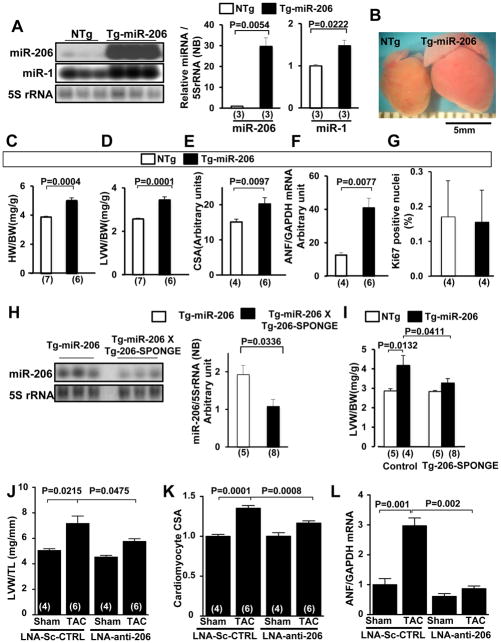
Figure 3. miR-206 promotes cardiac hypertrophy in vivo.
(A–G) Characterization of the lowest expressing line of Tg-miR-206 mice at 3 months of age. (A) Tg-miR-206 (line24) and non-transgenic control (NTg) mouse hearts were harvested for Northern blot analysis with a miR-206 probe, a miR-1 probe, or a 5S rRNA probe. (B) Representative heart pictures taken in PBS under a microscope. (C, D) Postmortem measurements of heart weight/body weight (HW/BW, mg/g) and left ventricular weight/body weight (LVW/BW, mg/g). (E) Quantitative analysis of myocyte cross-sectional area (CSA) by wheat germ agglutinin (WGA) staining is shown. (F) The level of ANF mRNA was evaluated by qRT-PCR analyses. (G) Ki67-positive nuclei/total CM nuclei was evaluated with anti-Ki67 and anti-Troponin T staining. (H and I) Tg-miR-206 and Tg-miR-206/Tg-206-SPONGE bi-transgenic mouse hearts were harvested for Northern blot analyses with a miR-206 probe and a 5S rRNA probe (H) and postmortem measurement of LVW/BW (mg/g) (I). (J–L) Wild-type C57B6 male mice were treated with LNA scrambled control or LNA-anti-206 by tail vein injection 7 days prior to intervention. Groups were subjected to 1-week TAC or sham operation. (J) Left ventricular weight/tibia length (LVW/TL) was determined. (K) Heart sections were stained with WGA and CM CSA was determined. (L) mRNA was isolated from ventricles and subjected to qRT-PCR to detect ANF levels. N=4–6.

